
CHAPTER 59 · FMC / TFM / PCI Level 3
Advanced Imaging and Coherence Methods
In this chapter · 29 sections
Why this matters
Advanced images can look dramatically different even when they use the same raw data. The reason is that each method rewards different evidence. Conventional delay-and-sum rewards aligned signed or complex amplitudes. Envelope methods remove sign before a later combination. Coherence methods measure agreement of phase or sign. Adaptive methods estimate weights from the data. Nonlinear methods deliberately change the relationship between input and output.
No method owns the truth. A clean background can mean that incoherent noise was suppressed, but it can also mean that a valid reflector did not match the method's preferred scattering behaviour. The safest comparison keeps the dataset, path, ROI and display conventions matched, then asks what evidence each method uses and which known target or artefact it emphasises.
What you already need
- Delay alignment predicts which parts of the traces belong to one image point.
- Amplitude and phase describe different properties of a waveform.
- Weak signals can have unstable phase.
- Geometry and coherent interference can imitate a compact reflector.
What you will learn
You will compare plane-wave, synthetic-aperture, coherence, PCI, hybrid and adaptive families; calculate simple coherence measures; explain why method names are insufficient; diagnose disagreement between amplitude and coherence views; and define a matched validation comparison.
Words you will meet
Coherence is a measure of agreement among aligned contributions. Phase coherence focuses on position within the waveform cycle. Adaptive beamforming derives some weights from the measured data rather than fixing them in advance. Nonlinear means that doubling the input does not necessarily double the output. Fusion combines evidence from more than one view or method under a declared rule.
The Level 3 step
At Level 2 the learner uses amplitude TFM and PCI as complementary views. At Level 3 the learner declares the exact implementation, challenges its failure modes and controls the inference made from disagreement. Statistical derivations are signposted toward the engineering chapters; the immediate responsibility is to understand what the algorithm is measuring.
59.1 Method families and evidence domains
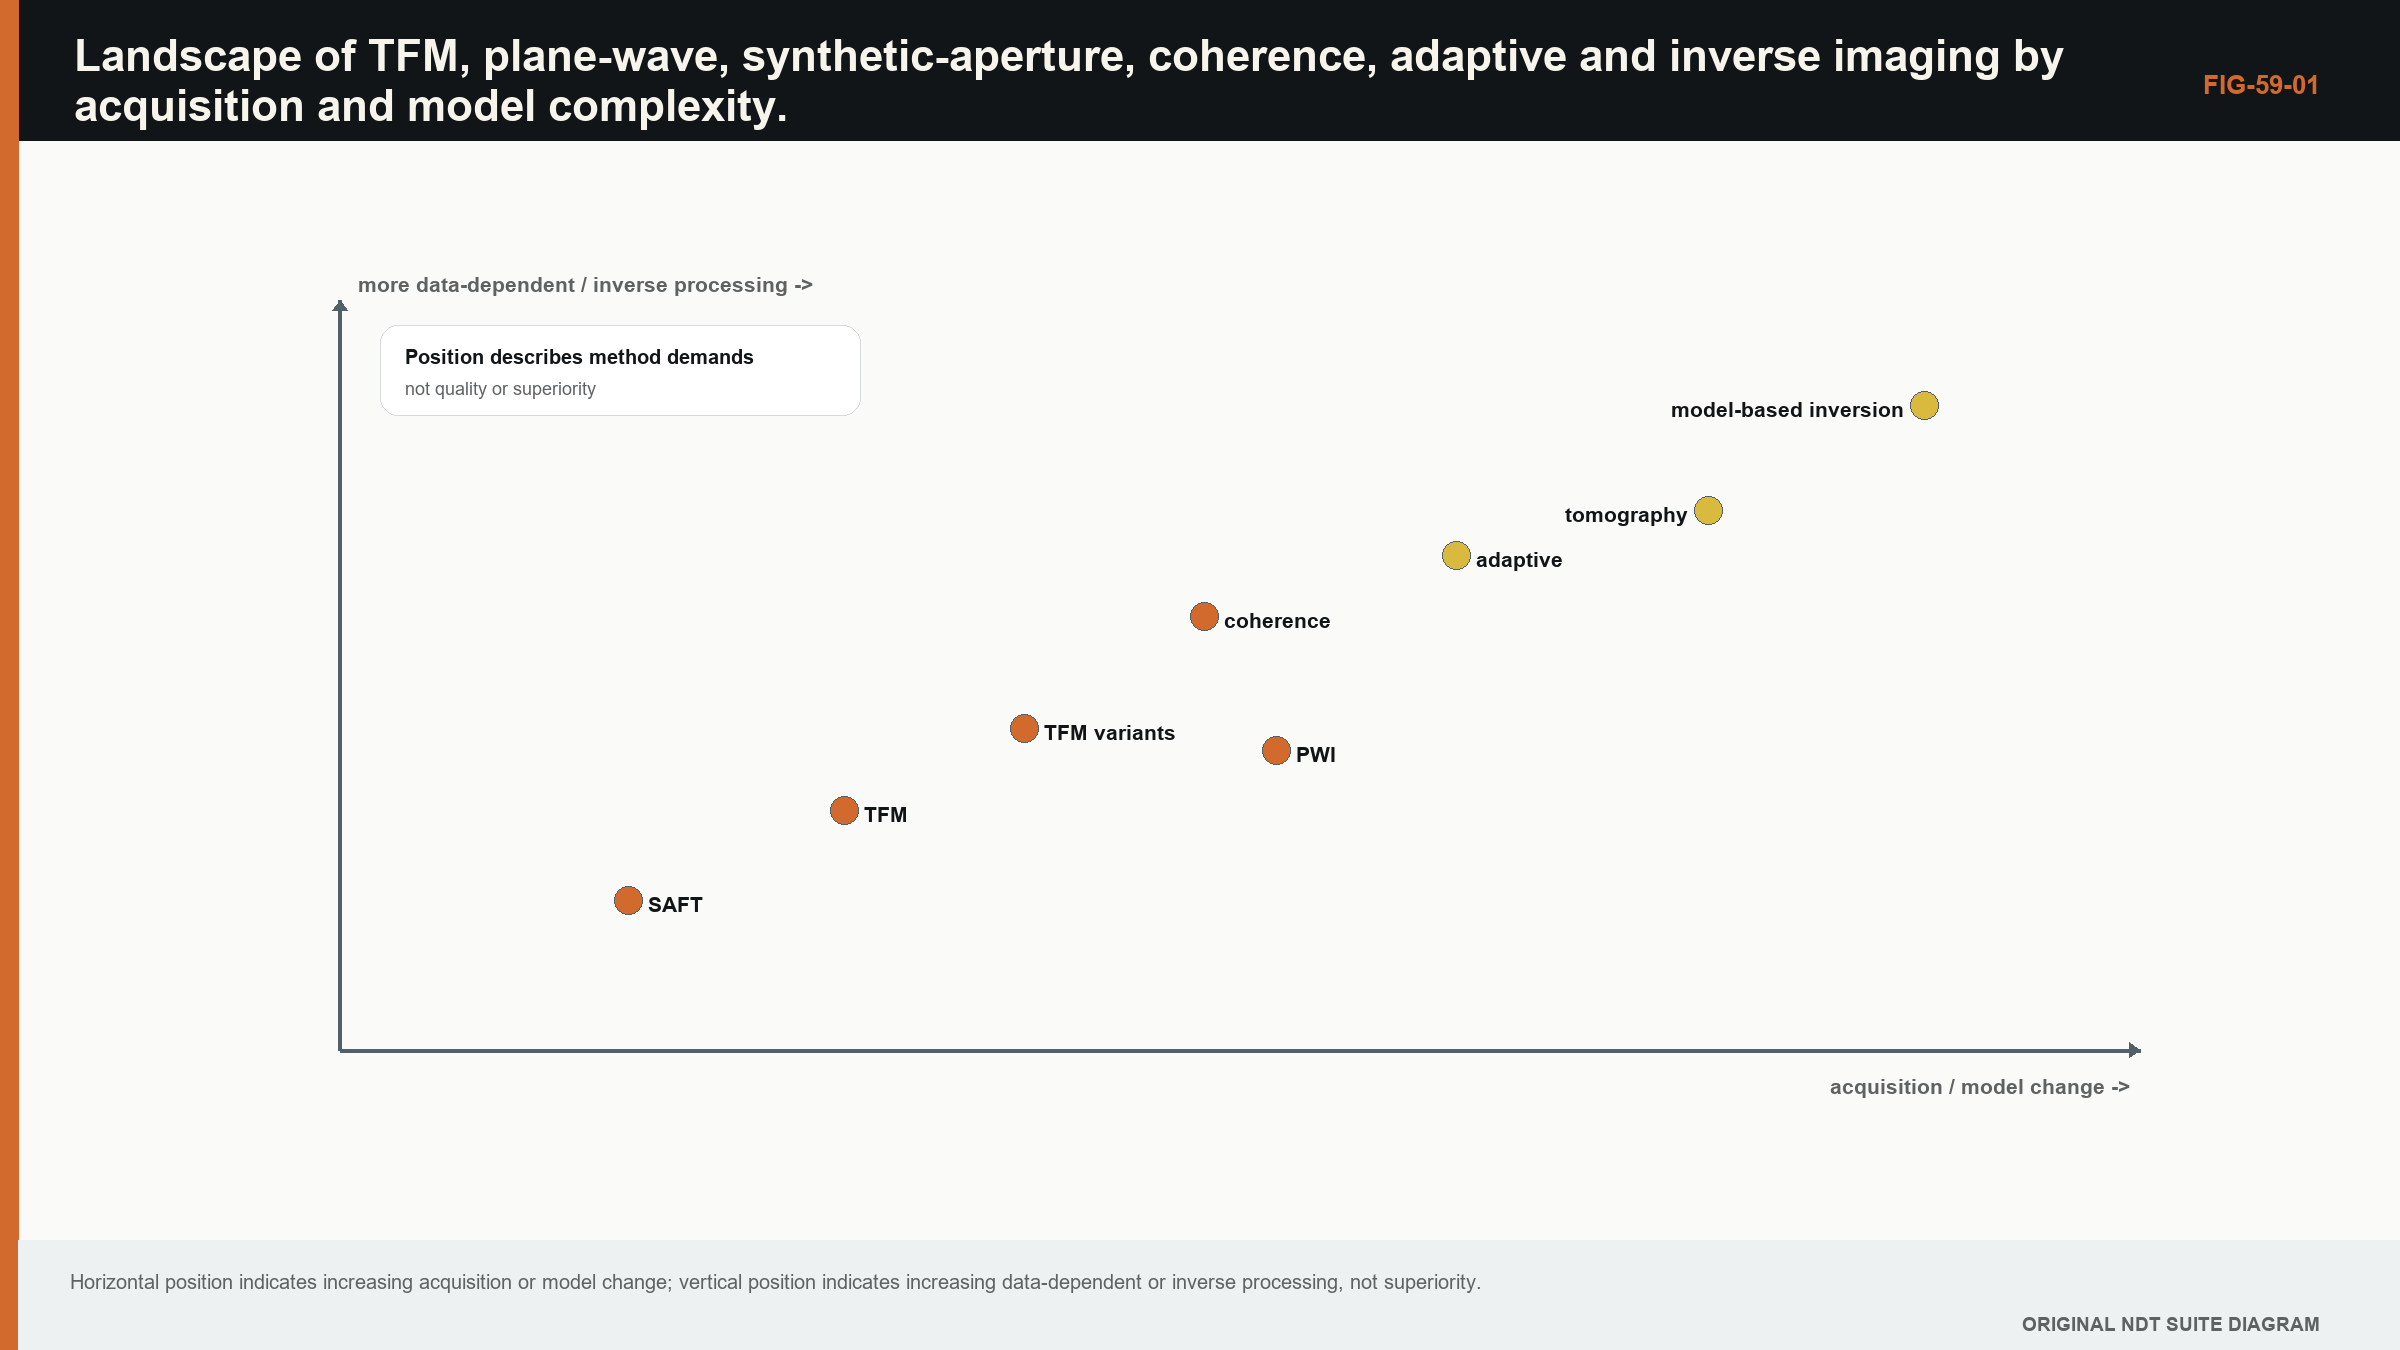
Advanced array imaging methods differ in acquisition, forward model, functional and prior assumptions. Plane-wave imaging changes transmission. Synthetic-aperture methods change spatial sampling. Coherence factors weight agreement among delayed channels. Adaptive beamformers estimate data-dependent weights. Tomographic and iterative methods solve broader inverse problems.
The output domain matters. Amplitude imaging retains a response related to coherent signal magnitude. Phase-only or sign-coherence images represent agreement and may intentionally remove amplitude. A low value can mean incoherence, low SNR, model error or target scattering that distributes phase. It is not automatically absence of a reflector.
The original named PCI work and related phase-coherence methods establish a family, while public vendor descriptions document specific implementations. [R025] [R029] Generic teaching should distinguish published concepts from product behaviour and avoid treating marketing comparisons as independent efficacy evidence.
59.2 Plane-wave imaging
Plane-wave imaging transmits several steered broad beams and receive-focuses them. Coherent compounding combines angles after reconstruction. It can reduce transmission count relative to FMC and increase frame rate. [R022]
Angular sampling controls transmit diversity. Too few angles leave gaps or coherent artefacts. Closely spaced angles add correlated information. Transmit aperture, apodisation and element directivity shape each plane wave, so it is never perfectly planar over the whole ROI.
Compounding can be coherent when phase references and path models are compatible, or incoherent when magnitudes are combined. The chosen operation changes sensitivity and speckle. An implementation should record transmit angles, weights and compounding order.
59.3 Synthetic-aperture focusing
SAFT combines data from spatially separated positions or elements to focus after acquisition. It assumes accurate positions and a forward model. It is closely related to delay-and-sum array imaging but can use mechanical motion to synthesise aperture.
The method is sensitive to position error and coupling variation. A larger synthetic aperture improves nominal lateral resolution while increasing the time span over which the component and coupling must remain stable. Aperture truncation at scan ends creates spatially varying PSF.
Frequency-domain SAFT variants exploit regular sampling for speed. Irregular motion requires resampling or a more general solver, each adding assumptions.
59.4 Coherence-factor families
A conventional coherence factor compares squared magnitude of the coherent sum with the sum of individual energies. It is high when channels align and low when they cancel. Multiplying amplitude TFM by this factor suppresses incoherent background while retaining amplitude influence.
| (59.1) Conventional coherence factor · EQ-59-01 Where: CF = coherence factor from 0 to 1; z_k = delayed analytic contribution; N = number of valid contributions Model limits: equal base channel weights, nonzero denominator and a phase representation meaningful at the evaluated samples |
|---|
Variants use subapertures, frequency bands, signs or phase statistics. Each responds differently to amplitude imbalance and outliers. A single bad high-amplitude channel can dominate some factors. Robust versions clip or rank contributions but introduce nonlinear behaviour.
59.5 Phase and sign coherence
Phase coherence computes concentration of analytic-signal phases. Sign coherence uses polarity or phase sectors and is less sensitive to exact amplitude. These methods can highlight diffracted tips whose channel phases align after delay even when amplitude is weak.
Phase becomes unstable when analytic amplitude approaches noise. A phase-only functional may give full weight to an almost zero sample. Amplitude thresholds or reliability weights can control this, but they reintroduce amplitude and a threshold model.
Phase wrapping is natural on the circle. Arithmetic averaging of degrees near -180 and +180 is wrong; circular statistics use unit phasors. Filter and analytic-signal choices affect phase, so those steps are part of the method.
59.6 PCI implementations and limits
PCI is used for approaches that form images from phase consistency, sometimes without conventional amplitude. A vendor implementation may define its own phase statistic, thresholds, smoothing and display scale. The product label should not be assumed to describe every research formulation.
Research on instantaneous phase coherence has reported reduced background for specific near-field aluminium experiments using a diffuse-field Green-function approach. The result is bounded to those experiments rather than proof of universal superiority. [R027] Simulation studies comparing PCI and delay-and-sum provide useful exploratory evidence but likewise depend on defect, noise and model. [R028]
Because a phase-only output has no ordinary amplitude scale, decibel rules from amplitude UT do not transfer automatically. A display can use a logarithm for visual compression, but its reference and physical interpretation must be defined.
59.7 Amplitude-coherence hybrids
Multiplying amplitude by a coherence weight preserves some amplitude ordering while suppressing incoherent contributions. Exponentiating the weight controls aggressiveness. The exponent is an algorithm parameter that can change feature size and detectability.
Additive fusion can display amplitude and coherence as separate channels or complementary panels. This avoids pretending they are the same quantity. Interpretation can require agreement, allow either domain to trigger review, or use one to qualify the other. The rule should be validated against targets and artefacts.
Normalising each domain separately can make weak coherence and strong amplitude look equivalent. Quantitative fusion should retain original scales and uncertainty.
59.8 Adaptive and nonlinear beamformers
Adaptive beamformers estimate weights from data covariance or local statistics to suppress interference and improve resolution. Minimum-variance methods can produce narrow responses but are sensitive to covariance estimation, diagonal loading, sample support and model mismatch.
Nonlinear beamformers may multiply, threshold or rank channel contributions. They can sharpen images but distort amplitude and PSF. Parameter tuning on a small target set risks overfitting.
Adaptive methods need adversarial validation: coherent geometry, correlated noise, multiple reflectors, low SNR and model error. A cleaner image is not enough; location, sizing bias and false calls must be measured.
59.9 Multi-view fusion
Views differ by path and target sensitivity. Fusion can be logical, statistical or image based. Logical fusion applies a rule such as review when either validated view responds. Statistical fusion estimates likelihoods under target and non-target models. Image fusion combines values after coordinate registration.
Path-specific artefacts can become stronger when maxima are taken across many views. Multiple-comparison effects raise the chance that noise peaks somewhere. The number and dependence of views should be considered when setting decision rules.
Multi-view research highlights both orientation benefit and artefact risk. [R018] [R019] Fusion should retain view identity so a reviewer can trace a combined feature back to contributing data.
59.10 Reproducibility and method naming
A method declaration includes acquisition, path, signal domain, interpolation, weights, coherence statistic, thresholds, normalisation, smoothing and software version. Terms such as phase coherence factor or PCI should be accompanied by an equation or controlled algorithm reference where possible.
Parameter sweeps should be retained, not only the best-looking image. If a small parameter change makes an indication appear or disappear, robustness is part of interpretation. Locked production parameters should trace to validation evidence.
Independent commercial evaluations are bounded by tested specimens and metrics. [R061] They can inform candidate methods without replacing application qualification.
| Worked example · Coherence factor for aligned and alternating phases WE-59-01 Known: Four unit analytic contributions are evaluated. Case A phases are all 0 degrees. Case B phases alternate 0 and 180 degrees. Find: Conventional coherence factor in each case. Method: Case A coherent sum magnitude is 4, so numerator is 16; denominator is 4 x 4 = 16, giving CF = 1. Case B coherent sum is zero, giving CF = 0. Result: The ideal aligned set has full coherence; the alternating set has none under this functional. Engineering meaning: The factor measures agreement with the delay and phase model. A physical reflector can score low if its scattering reverses polarity or the path model is wrong; coherent geometry can score high. |
|---|
Guided Level 3 case: amplitude and coherence disagree
An amplitude TFM view shows a moderate planar response with surrounding structural noise. A phase-coherence image gives the same location low contrast, while a compact geometry response elsewhere becomes very strong. The correct response is not to choose the cleaner image. The Level 3 task is to explain the evidence used by each method and test the conditions that can create the disagreement.
Keep the dataset, path, ROI, contributor mask and coordinates fixed. Confirm that the amplitude view uses the declared RF or analytic quantity and that the coherence implementation matches its controlled definition. A product called PCI by one supplier may not calculate the same value as another product. Save the implementation profile, including preprocessing, phase convention, support threshold, weighting and normalisation.
Inspect the raw aligned contributions at the planar target. Confirm that usable signal exists above the phase-reliability floor. A weak trace can carry a visually definite phase even though its phase is dominated by noise. Examine whether the reflector's scattering changes polarity or waveform shape across the aperture. A valid planar response can have lower circular concentration than a compact point-like source.
Now challenge the strong geometry response. Reconstruct a neighbouring path, adjust the velocity within its supported range and change the aperture symmetrically. If the feature tracks a known surface or moves with the path model, geometry is a stronger explanation. Stable coherence does not make an acoustic path unique.
Use reference targets representing both behaviours. Include compact reflectors, planar reflectors at relevant orientations, no-flaw geometry and realistic grain or interface noise. Compare detection, localisation, false calls and response stability, not only background appearance. If a coherence method suppresses the target class of interest, its clean image is not an improvement for that decision.
The conclusion treats the two views as complementary. Amplitude TFM supports one set of waveform relationships; coherence supports another. Agreement can increase confidence only when their failure mechanisms are understood, and disagreement is diagnostic evidence rather than an automatic vote. The technique record states which output supports detection, which supports interpretation and which outputs are not used for sizing or acceptance.
59.90 Technical extension: statistical behaviour and validation of coherence
59.90.1 Finite-channel bias
Coherence estimates are biased upward when only a few channels contribute. Random phasors do not produce exactly zero concentration in a finite sample. Pair count and weight distribution therefore affect the background scale.
A coherence image should expose valid channel count. Thresholds calibrated with one aperture may not transfer to another. Simulations or noise regions can establish the null distribution under representative correlation.
59.90.2 Correlated noise
Electrical interference, geometry and grain scattering can be correlated across channels. Correlated noise produces high coherence and defeats independent-phasor assumptions. Estimate covariance or compare subapertures to reveal common modes.
Whitening can reduce known correlation but depends on a stable covariance estimate. If the estimate includes targets, whitening can suppress them. Separate noise data and regularisation are needed.
59.90.3 Aperture-support maps
Coherence from a narrow angular cluster can be high but poorly discriminating. Record angular span, effective aperture and pair count alongside the score. A minimum-support rule may exclude pixels that are mathematically coherent but weakly observed.
Support rules change sensitivity near ROI boundaries. Their transitions should be tested so a feature is not created by normalisation at the support edge.
59.90.4 Low-amplitude phase reliability
Analytic phase variance increases as SNR falls. Reliability weights can depend on amplitude relative to noise, local bandwidth or phase stability. These choices reintroduce amplitude and should be named rather than presenting the result as purely phase based.
Hard gates create discontinuities; soft weights create parameter-dependent bias. Validate both target retention and false-coherence suppression across SNR.
59.90.5 Coherence PSFs
The PSF of a nonlinear coherence method depends on signal amplitude, noise and target scattering, not only geometry. Measure or simulate it across depths and target types. A very narrow coherence feature can reflect nonlinear sharpening rather than improved ability to resolve two targets.
Two-target tests are needed for resolution. Compare detection and separation, not just isolated feature width.
59.90.6 Parameter stability
Sweep coherence exponent, subaperture size, phase gate, filter and smoothing across a declared range. A robust target persists with predictable change. Features appearing in a narrow parameter corner deserve caution.
Parameter selection should use development data and remain locked for confirmation. Saving only the selected result loses evidence of tuning sensitivity.
59.90.7 Adaptive-beamformer conditioning
Covariance matrices can be ill conditioned when sample support is small. Diagonal loading stabilises inversion but changes resolution and suppression. The loading value is an essential parameter.
Report condition number, effective sample count and fallback behaviour. An algorithm that silently returns conventional beamforming after failed inversion should flag that state.
59.90.8 Multiple-view false positives
Taking the maximum across many coherence views raises the chance of a high noise or geometry score. Validation should use the same number and dependence of views as production. Statistical thresholds or confirmation rules may need adjustment.
Requiring agreement can reduce false calls but also miss orientation-specific targets. The rule follows the target and consequence model.
59.90.9 Cross-domain interpretation
Amplitude and coherence should be treated as paired evidence. A high-amplitude, low-coherence response may indicate model mismatch, extended scattering or saturation. A low-amplitude, high-coherence response may indicate a weak compact target or coherent noise.
Interpretation matrices based on these combinations should be validated, not improvised. Raw traces remain the arbitration layer.
59.90.10 Validation endpoints
Useful endpoints include detection, location, sizing bias, geometry false calls, parameter robustness and reader consistency. A background-reduction ratio alone is not sufficient.
Bound claims to tested materials, targets and acquisition. [R022] [R025] [R026] [R027] [R028] [R029] [R061]
59.91 Coherence decision boundaries
A coherence threshold should be derived from target and non-target distributions under the intended pair support, SNR and path model. Because the statistic changes with channel count and correlation, one threshold should not be transferred across apertures without evidence.
Receiver-operating analysis can compare sensitivity and false calls, but the development threshold should be locked before confirmation. Include coherent geometry, electrical interference, low-amplitude noise and extended reflectors. Otherwise the study rewards a method for rejecting only incoherent Gaussian background.
Interpretation can use joint amplitude-coherence regions. For example, high amplitude with low coherence triggers model or saturation review; low amplitude with high coherence triggers raw-SNR and geometry review. These are triage categories, not universal flaw classes, and need application validation.
Reader displays should show support count and allow raw traces. A single saturated coherence colour removes the distinction between moderately and perfectly aligned phases. Fixed scales and retained numeric values improve comparison.
When a method suppresses a known target, investigate phase reversal, roughness, anisotropy, bandwidth and analytic processing before declaring the target unsuitable. The method selects an evidence property; qualification determines whether that property represents the required target population. [R025] [R026] [R027] [R028] [R029]
59.92 Interpretation of discordant coherence
When amplitude and coherence disagree, examine four conditions in order. Confirm that raw signal is above the phase-reliability floor. Confirm that the path aligns waveform features across the aperture. Decide whether the target is expected to preserve phase under its scattering behaviour. Finally, challenge whether geometry or interference can create the same coherence. This sequence avoids interpreting the score before its inputs.
Subaperture analysis is useful. A true well-modelled compact target should often remain coherent across overlapping subapertures, while one bank fault or narrow angular geometry support appears only in selected groups. The expectation depends on target directivity and must be validated.
Report coherence as its own quantity with support and method parameters. If a logarithmic display is used, state the linear statistic and reference. Do not apply conventional amplitude evaluation rules merely because the colour bar is labelled dB. [R025] [R026] [R027] [R028] [R029]
59.93 Phase-domain limitation statement
Every coherence result should retain a limitation statement covering low-amplitude phase, support count, model alignment and coherent non-target response. These are intrinsic interpretation conditions, not caveats that disappear when the display looks stable. [R025] [R026] [R029]
59.94 Coherence provenance
Store the linear coherence statistic, valid-pair mask and amplitude reliability input before colour or logarithmic mapping. This allows a later reviewer to distinguish statistical behaviour from display choices. [R025] [R029]
Chapter synthesis
Advanced imaging methods alter acquisition, functional or assumptions. Plane-wave and synthetic-aperture approaches trade transmissions and motion against sampling. Coherence factors measure delayed-channel agreement; phase and sign variants reduce amplitude dependence but become fragile at low signal. PCI names a family and implementations differ. Hybrids, adaptive and nonlinear beamformers can improve selected metrics while introducing new parameters and bias. Multi-view fusion needs coordinate registration, artefact control and retained view identity. Reproducibility depends on equations, parameters and versions rather than a method label.
Key equations and relationships
| (59.2) Circular phase concentration · EQ-59-02 Where: C_phi = phase concentration; phi_k = phase of delayed contribution k; N = valid contributions Model limits: phase estimates are meaningful and any amplitude reliability rule is declared separately |
|---|
In plain words
- The chapter's central control is coherence, and its meaning must be stated before its mathematics or software implementation.
- A faster, sharper or cleaner result is not automatically a more reliable result.
- Every claimed improvement depends on a declared dataset, model, configuration and target population.
- Known reference cases and deliberately difficult cases reveal different weaknesses.
- Stored raw evidence, metadata and software identity make later review possible.
- The technical conclusion must remain inside the boundary demonstrated by the evidence.
Key terms in this chapter
The words introduced at the chapter opening are the minimum vocabulary for its Level 3 work. Use them consistently in the technique, validation record and report. Where a supplier uses a different label, record the supplier term without allowing it to replace the physical definition.
Common mix-ups
- Do not confuse a similar displayed image with equivalent retained information.
- Do not confuse software verification with physical validation of an inspection technique.
- Do not confuse an assumed model output with a directly observed quantity.
- Do not confuse a demonstrated result for one target population with universal capability.
Independent review checkpoint
Give a second competent reviewer the raw or reference data, the declared coherence method, the controlled configuration and the expected comparison outputs. The reviewer should be able to reproduce the important result without using an undocumented display adjustment or private software setting. Record the version, input identity, contributor or channel mask, model inputs, numerical tolerances and any excluded cases. Also record one observation that would contradict the preferred explanation. Where the result supports a decision, the reviewer records the nearest failure boundary and one realistic change that would trigger revalidation. This checkpoint does not turn independent review into a ceremonial signature. It tests whether the evidence chain is understandable, repeatable and honest about its limits.
Bridge forward
Chapter 60 uses those method choices as design variables and balances coverage, resolution, speed and robustness.
Sources and further study
- [R018]
- [R019]
- [R022]
- [R025]
- [R026]
- [R027]
- [R028]
- [R029]
- [R061]
Study and revision only. This is not an approved inspection procedure, acceptance criterion or qualification.