
CHAPTER 1 · Ultrasonics Level 1
What Ultrasonic Testing Is
Ultrasonic testing begins with an idea most people already understand: an echo takes time to come back. This chapter turns that familiar idea into the first useful picture of an ultrasonic test.
In this chapter · 13 sections
Start Here: You do not need to be an engineer to read this chapter. We will build the physical picture first, introduce only the words that are needed, and leave the deeper mathematics for later chapters.
1.1 An echo you already understand
Imagine standing in a large empty shed and clapping your hands. You hear the clap immediately. A moment later, you may hear a second sound. That second sound is an echo. The sound travelled away from you, met a wall and returned. If the wall were farther away, the echo would take longer to return. Nothing about that idea requires specialist knowledge; it is the starting point of ultrasonic testing.
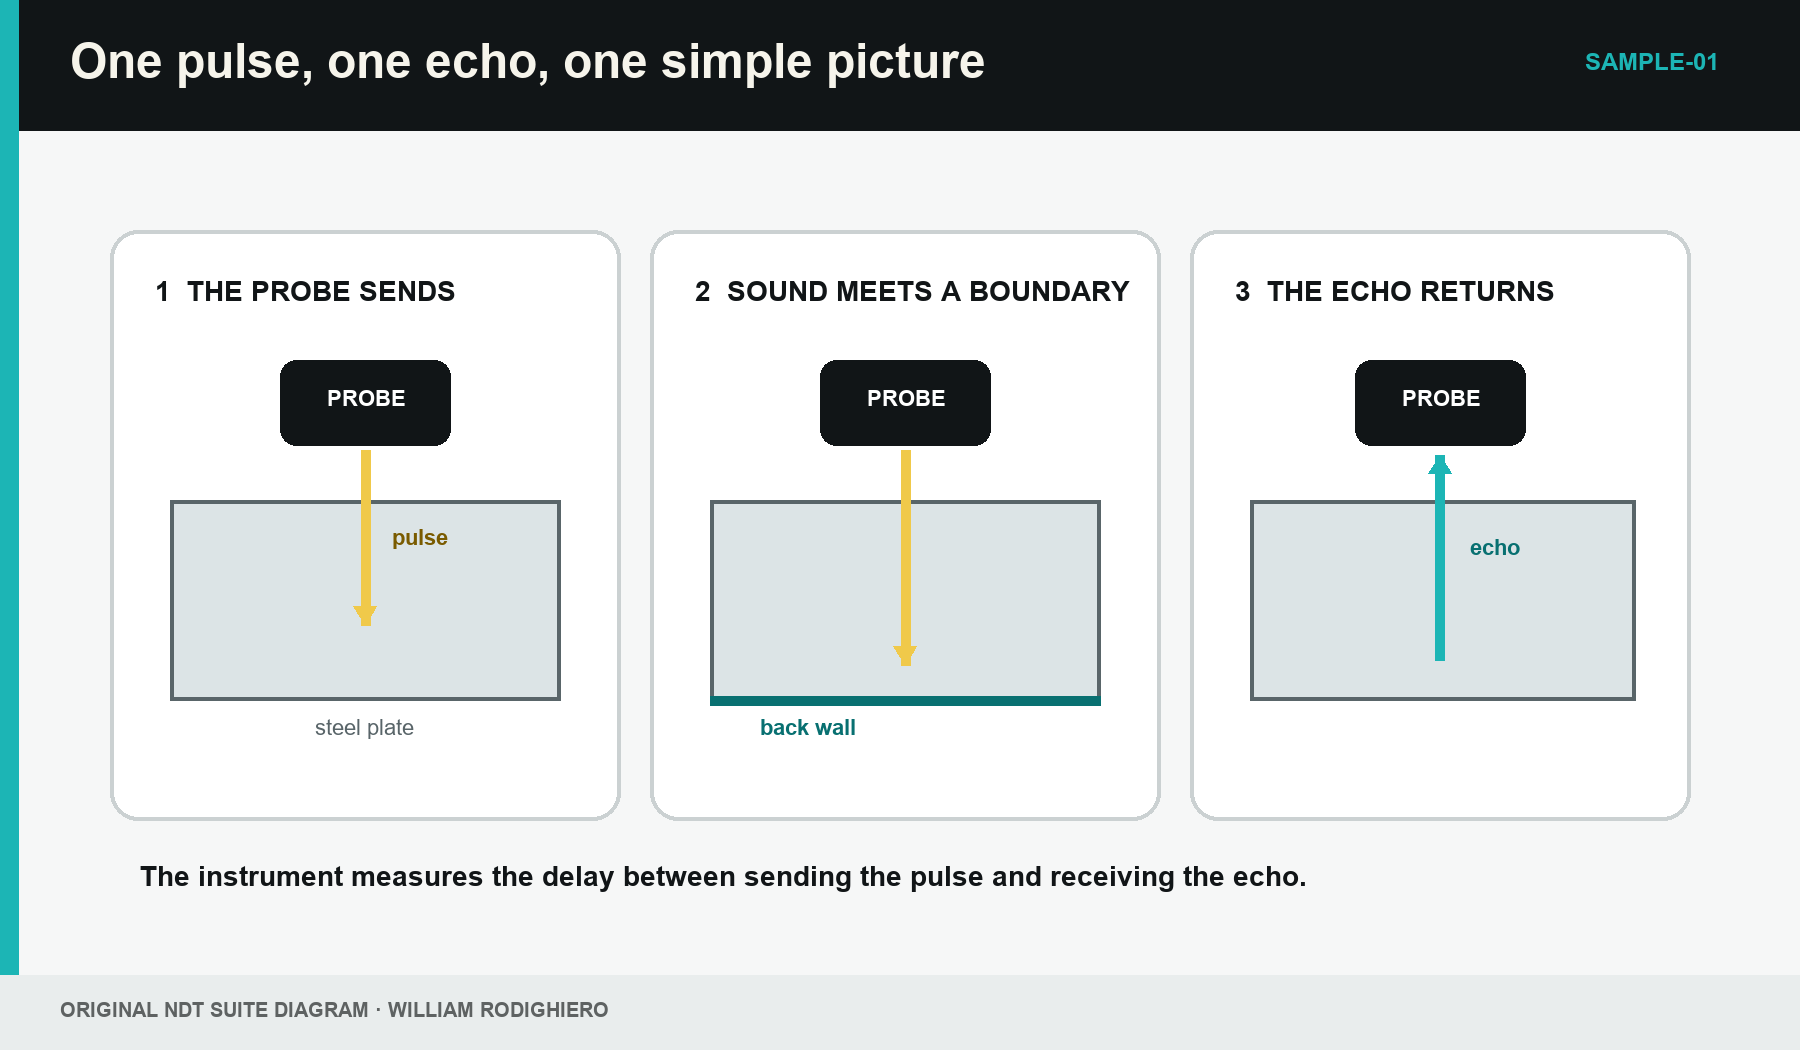
Ultrasonic testing uses the same basic event on a much smaller scale. Instead of a hand clap, the equipment produces a very short burst of vibration. Instead of listening with an ear, a probe receives the returning vibration. Instead of waiting long enough to notice the delay yourself, an electronic instrument measures a delay that may last only a few millionths of a second.
The test therefore begins with three simple questions. Was a pulse sent into the component? Did any sound return? How long did it take? Later, we will ask more difficult questions about the returning signal. For now, those three are enough.
1.2 What the word ultrasonic means
Sound is a mechanical vibration that travels through a material. When a loudspeaker moves, it pushes and pulls on the air beside it. That motion passes from one region of air to the next until it reaches your ear. Sound can also travel through water, steel, aluminium and many other solids and liquids. It cannot travel through a perfect vacuum because there is no material there to carry the vibration.
Frequency tells us how many vibration cycles occur each second. The unit is the hertz, written Hz. A frequency of 1,000 Hz means 1,000 cycles each second. Human hearing covers only part of the possible frequency range. Sound above the normal upper limit of human hearing is called ultrasound. Industrial ultrasonic testing commonly works at frequencies measured in megahertz. One megahertz, written MHz, is one million cycles each second.
The high frequency is useful because it allows short pulses and relatively small features to influence the sound. It does not mean the equipment is simply 'louder than hearing'. Frequency and loudness are different ideas. Ultrasound is named for its frequency, not for how powerful it feels.
In Plain Words: Ultrasound is sound vibration at a frequency too high for normal human hearing. The test equipment sends that vibration through the component and listens for what comes back.
1.3 The probe is both a sender and a listener
The part placed on the component is called the probe or transducer. Inside a simple probe is an active element that changes electrical energy into mechanical vibration. When the instrument applies a short electrical pulse, the element moves and creates an ultrasonic pulse. When an echo returns, the same element can work in reverse and produce a small electrical signal for the instrument.
This two-way change is the reason the probe can act as both sender and listener. The instrument is not looking directly into the steel. It is creating an electrical pulse, using the probe to turn that pulse into vibration, and then turning the returning vibration back into an electrical signal. The display is the final representation of that chain.
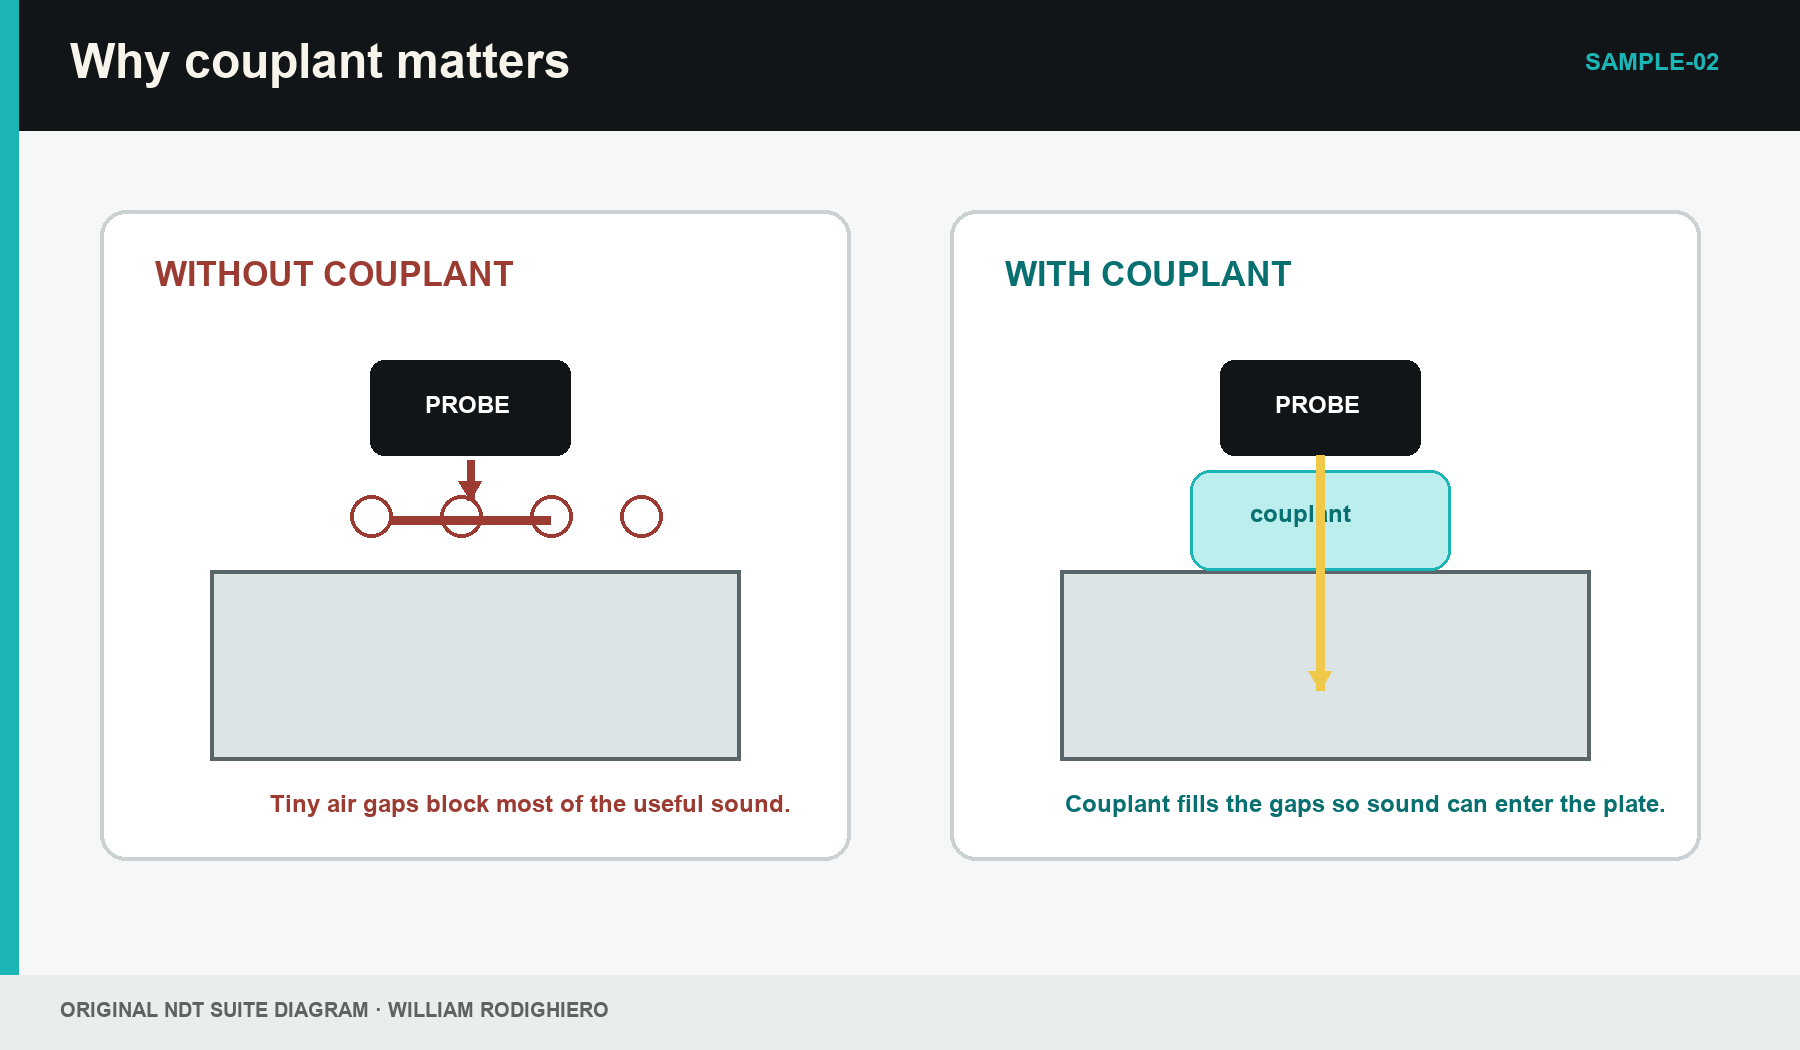
A cable connects the probe to the instrument. A thin layer of couplant—often a gel, liquid or paste—sits between the probe and the component. The couplant is not an optional extra. It fills the tiny gaps that would otherwise contain air. The component itself completes the basic test arrangement.
1.4 Why a thin layer of couplant matters
A probe face and a steel surface may look smooth, but at a small scale both contain peaks and hollows. If the probe is placed on the dry surface, many of those hollows contain air. The boundary between the probe and the air reflects most of the ultrasonic energy before it can enter the steel. The instrument may then show a weak, unstable or missing back-wall echo.
Couplant fills the hollows and replaces most of the air. This gives the vibration a much better route into the component. A small amount is normally enough. Pressing harder is not a reliable substitute for couplant, and a very thick uneven layer can also make a reading unstable.
This explains a common beginner experience: the trace changes when the probe is moved, even though the steel has not changed. The coupling changed. Learning to recognise that difference is part of learning the method.
1.5 The journey through a simple steel plate
Consider a flat steel plate with parallel front and back surfaces. The probe is placed on the front surface. The pulse enters the steel and travels toward the back surface. When it reaches the boundary between steel and the air beyond the plate, much of the sound is reflected. The reflected part travels back to the probe and becomes the back-wall echo.
The instrument measures the time between sending the pulse and receiving that echo. The time covers both parts of the journey: from the probe to the back wall, and from the back wall to the probe. That round trip is the central idea behind a pulse-echo thickness measurement.
Real components can be curved, coated, rough, corroded or made from materials that scatter sound. Those complications matter, but they should not be introduced before the simple picture is secure. The flat plate is our first model. A model is a useful simplified picture, not a promise that every component behaves exactly the same way.
1.6 The A-scan: a graph, not a photograph
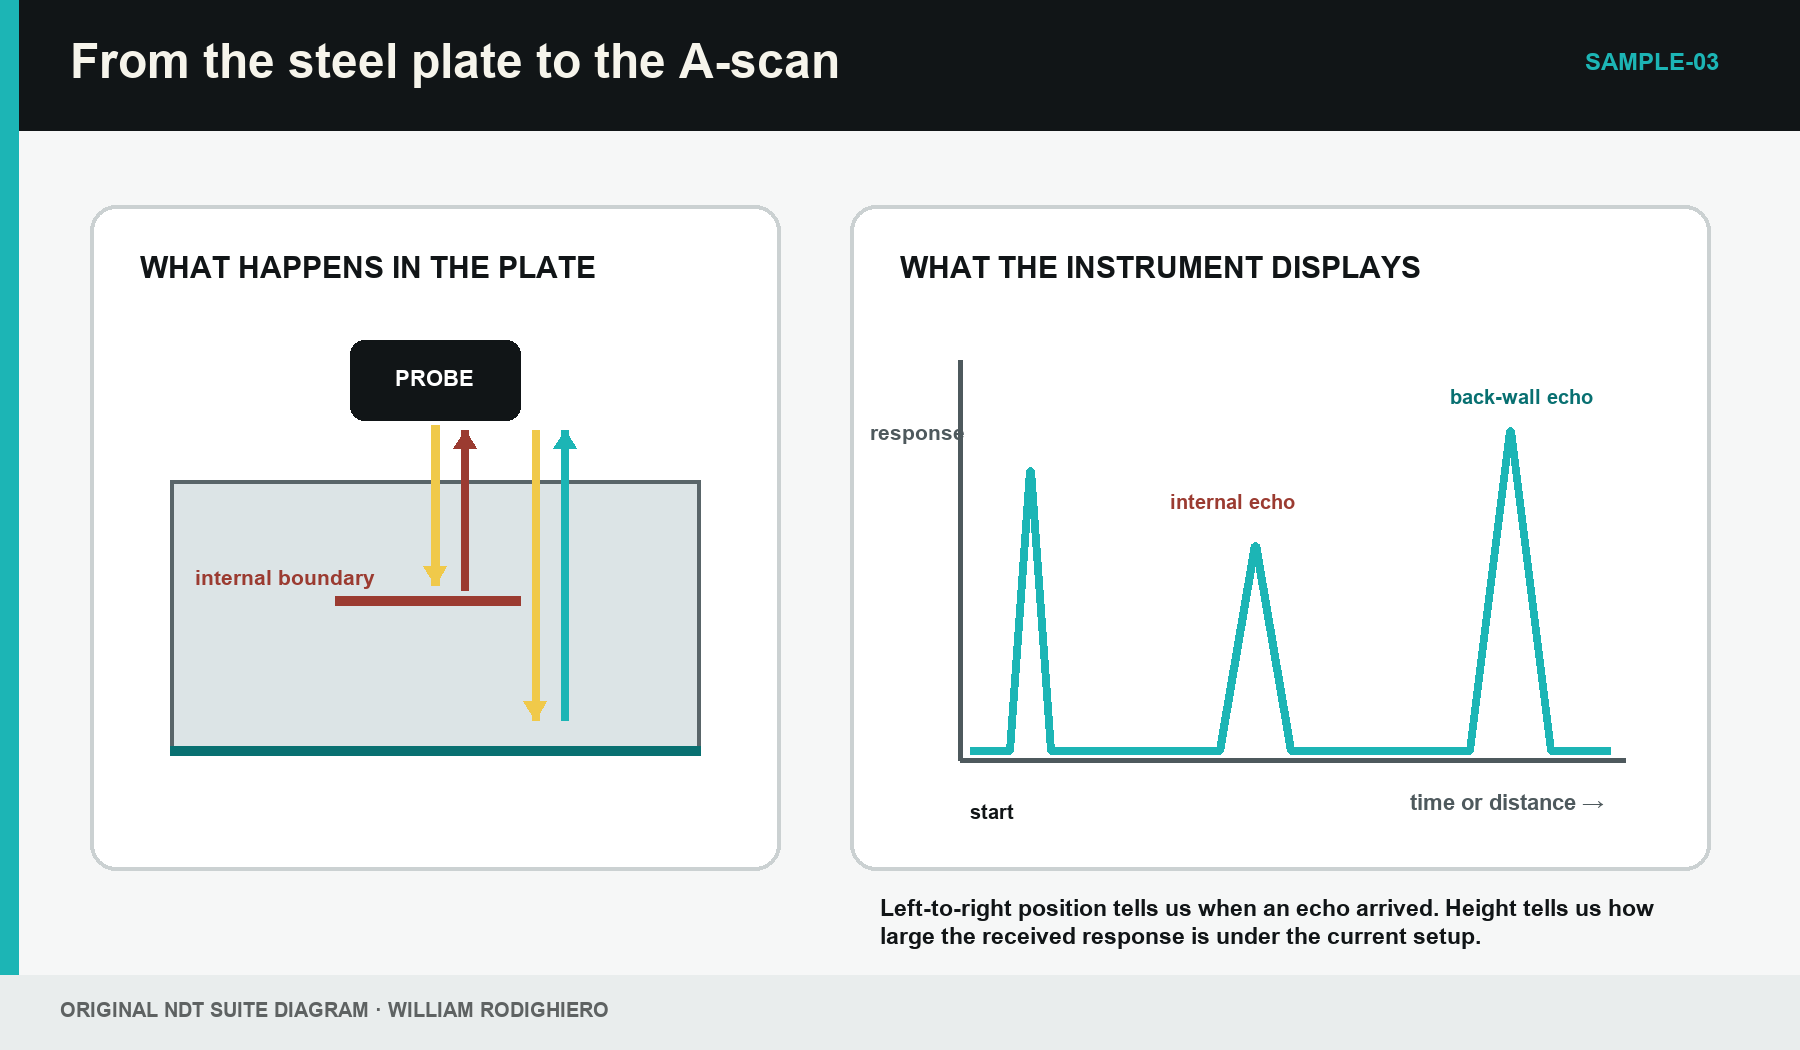
The simplest ultrasonic display is called an A-scan. It is a graph. The horizontal direction runs from left to right and represents passing time. On an instrument that has been set up correctly, that time can also be shown as distance. The vertical direction represents the size of the electrical response received by the instrument.
Near the left side, the display often contains a large response associated with the transmitted pulse and the entry into the component. A later peak may be the back-wall echo. If there is an internal boundary along the sound path, some of the pulse may return before it reaches the back wall. That earlier return appears farther to the left than the back-wall echo because it had a shorter journey.
This is the first screen-reading habit to learn: left-to-right position and peak height do not mean the same thing. Position tells us when the response arrived. Height tells us how large the received signal is under the current settings. A tall peak is not automatically a large crack, and a small peak is not automatically unimportant.
1.7 Turning travel time into distance
If we know how fast the sound travels and how long the round trip took, we can estimate the one-way distance to the reflecting boundary. The relationship is easiest to understand in words before it is written with symbols.
| (1.1) Pulse-echo distance in words · EQ-01-01 Where: one-way distance is the distance from the probe to the identified reflecting boundary Model limits: a pulse-echo round trip, one effective sound speed and a correctly established timing origin |
|---|
The division by two is there because the measured time includes the outward journey and the return journey. Forgetting it produces a distance that is twice the one-way thickness.
A first worked example
Suppose the round-trip time to the back wall is 20 microseconds. One microsecond is one millionth of a second. For this teaching example, use a sound speed in steel of 5,900 metres per second.
First convert the time: 20 microseconds = 20 × 10⁻⁶ seconds. Then multiply speed by round-trip time: 5,900 × 20 × 10⁻⁶ = 0.118 metres. Finally divide by two: 0.118 ÷ 2 = 0.059 metres, which is 59 millimetres.
Result: Under the stated assumptions, the indicated plate thickness is 59 mm. The calculation is simple; identifying the correct echo and using the correct sound speed are the parts that require care.
An instrument may perform this calculation automatically, but it still needs the correct material velocity and timing setup. A digital reading is not independent proof that those inputs were right. Later chapters explain calibration, zero correction and measurement checks. At this stage, the important point is to understand the journey represented by the number.
1.8 What an internal echo may mean
An echo can return from any boundary that changes the sound path enough to reflect part of the pulse. The back surface is one boundary. An internal layer, inclusion, lamination, void or crack-like surface may create another. Normal component shape can also create echoes. A hole, edge, radius or change in thickness is not a material flaw, but it can still reflect sound strongly.
For this reason, the screen response is called an indication until its cause is understood. An indication is something noticed in the data. A discontinuity is a physical break or change in the normal material structure. A defect is a discontinuity that fails an applicable acceptance rule. The words describe different stages of understanding and should not be swapped casually.
At beginner level, a good observation is plain and factual: 'A repeatable echo appears before the back-wall echo when the probe is at this position.' That statement can be checked. Saying 'there is a rejectable crack' would go far beyond the evidence available from this simple view.
1.9 Why echo height can mislead
The height of a peak depends on more than the size of the reflecting feature. It also depends on the direction the feature faces, the probe position, the sound beam, coupling, distance, material loss and instrument settings. Increasing gain makes the displayed peaks taller without changing anything inside the component.
A small flat boundary facing the probe can return a strong echo. A larger flat boundary tilted away from the probe may return little sound. Curved geometry can concentrate or spread the return. Rough or coarse material can add background responses. This is why ultrasonic interpretation cannot be reduced to 'taller means bigger'.
Echo height is useful when it is compared under controlled conditions. The controls are learned progressively: first stable coupling and a known back wall, then reference reflectors, calibrated sensitivity and technique-specific rules. Each later step is built on the simple picture developed here.
1.10 What ultrasonic testing can and cannot do
Ultrasonic testing is especially useful when the sound can reach the region of interest and the feature changes the sound in a detectable way. It can measure thickness from one accessible side, search for internal reflectors, examine weld volumes and support mapping of corrosion or laminations. More advanced arrangements can steer beams, collect many signal paths and build images.
The method also has limits. Rough surfaces can make coupling difficult. Coarse materials can scatter the sound. Very thin regions close to the entry surface can be hidden by the transmitted pulse. A flat feature that faces away from the beam may be difficult to detect. Complex shape can create echoes that look important until the geometry is understood.
These are not reasons to distrust the method. They are reasons to choose the technique carefully and to describe the evidence honestly. The equipment provides measurements and displays. The person using those measurements must still understand the sound path, the component and the limits of the test.
1.11 The picture to carry forward
You can now follow the complete beginner picture. The instrument creates a short electrical pulse. The probe turns it into ultrasonic vibration. Couplant helps the vibration enter the component. The pulse travels, meets a boundary and returns as an echo. The probe turns the echo back into an electrical signal. The A-scan shows when that response arrived and how large it was under the current setup.
Nothing in the later book replaces this picture. Level 2 adds more careful setup, calibration, scanning and interpretation. Level 3 examines technique design, performance and uncertainty. Phased arrays use many elements and many sound paths. FMC and TFM store and combine large sets of signals. Engineering chapters add modelling, probability and system design. The foundation remains a pulse, a path, an interaction and a received signal.
Chapter Summary: Ultrasonic testing uses high-frequency mechanical vibration to gather evidence from inside a component. An A-scan is a graph of received response against time or distance. Echo position and echo height answer different questions. A pulse-echo distance uses half the round-trip journey. The display is evidence to understand—not a photograph and not an automatic accept-or-reject decision.
Where the textbook goes next
Chapter 2 begins with materials. It explains why sound travels cleanly through some components but becomes weak or noisy in others. Only after that physical picture is clear do we introduce wavelength, wave type and the calculations used by technicians and engineers.
References and free further reading
The introductory sequence was checked against the freely accessible IAEA ultrasonic-testing training guidance [R001] and NASA's foundational ultrasonic principles text [R002]. The complete source details and links appear in the reference register at the end of this book.
Study and revision only. This is not an approved inspection procedure, acceptance criterion or qualification.