
CHAPTER 44 · Phased Array Ultrasonics Level 3
Combining Views Without Hiding Conflict
In this chapter · 25 sections
Why this matters
One PAUT view shows a strong planar response, an opposite view shows two weak diffracted tips, and time-of-flight diffraction (TOFD) gives a larger height. Averaging the three numbers would create a neat answer while hiding that the methods may not be measuring the same boundaries. Level 3 interpretation is the disciplined comparison of physical explanations, data quality, path assumptions and measurement uncertainty. This chapter begins with the conflicting indication, defines inference and fusion in plain language, then builds an evidence ledger for complementary views, boundary sizing, bias control and reporting. The aim is a decision another competent person can reproduce from the retained signals.
What you already need
- Competent PAUT Level 2 interpretation of A-, S-, B- and C-scan information.
- Practical recognition of specular, tip-diffracted, geometry and noise responses.
- Coordinate registration, calibration and uncertainty foundations from Chapters 40–41.
- Qualification and complex-path reasoning from Chapters 42–43.
- Basic root-sum-square combination of independent standard uncertainties.
What you will learn
- Treat interpretation as comparison of physical hypotheses.
- Distinguish more views from genuinely independent evidence.
- Register PAUT, TOFD and conventional UT results in one coordinate frame.
- Select and validate physical boundaries for sizing.
- Use uncertainty, bias and reader variation without hiding conflict.
- Report conditional or unresolved results when evidence remains incomplete.
Words you will meet
- Inference: conclusion drawn from observations under stated assumptions.
- Hypothesis: candidate physical explanation for a response.
- Fusion: controlled combination of evidence from multiple views or methods.
- Independence: degree to which evidence avoids shared failure causes.
- Morphology: shape and behaviour of a response across position and view.
- Registration: alignment of results in a common coordinate frame.
- Boundary: physical end or surface used to define a dimension.
- Bias: systematic measurement difference from reference truth.
- Correlation: shared movement or uncertainty between results.
- Confidence: defined strength and completeness of supporting evidence.
44.1 Start with the disagreement before choosing a winner
The continuing case is a planar-looking weld response. A pulse-echo PAUT group from side A produces a strong continuous indication aligned with the fusion face. A group from side B produces two weaker responses that behave like diffracted tips. Registered TOFD reports a height 1.8 mm larger than the PAUT tip-to-tip value.
Do not begin by ranking the instruments. First confirm that all data are valid and that the reported values refer to the same component frame and physical boundaries. Check clipping, coupling, element health, calibration state, acquisition completeness, software version, velocity, index offsets and path identity.
Next preserve the conflict. The strong planar response may be specular evidence from a flaw face, or coherent geometry. The two weak responses may be physical tips, small volumetric reflectors or sidelobe structure. The TOFD values may identify diffraction boundaries, or one cursor may sit on another phase feature. These are competing explanations to test.
The Level 3 output is not necessarily one number. It may be a supported height, a bound, a conditional value under a stated path, or an unresolved observation requiring another view. Technical honesty is not indecision; it is refusing to manufacture certainty from incompatible measurements.
44.2 Define inference, fusion and confidence in practical terms
An ultrasonic image is a display created from signals, coordinates, path assumptions and processing. Inference means deciding which physical explanation best accounts for those observations. It is more than noticing a bright shape.
A hypothesis is one candidate explanation. For the continuing case, useful hypotheses include a planar fusion flaw, root or fusion-face geometry, mode-converted geometry, a pair of crack tips, clustered volumetric reflectors, material structure and processing artefact. Each hypothesis should predict something observable.
Fusion means combining evidence through a declared rule. Placing screenshots beside each other is comparison, not yet fusion. Blending colour images can communicate overlap but does not establish which path or boundary is correct.
Independence describes how little the evidence shares its important failure causes. Adjacent PAUT angles using the same elements, velocity and coordinate transform are strongly dependent. An opposite-side path or diffraction method may be more complementary. It can still share geometry and registration errors.
Bias is a systematic difference between a measurement and reference truth for a defined population. Confidence should describe evidence conditions, not the analyst's mood. It can state that the path is validated, two boundaries resolve, complementary views converge, data quality passes and the case lies within the demonstrated sizing range.
These plain meanings prevent mathematical weighting from arriving before the physical observations are understood.
44.3 Build an evidence ledger around predictions
List each hypothesis against expected coordinate, angle band, waveform, movement with probe position, response from the opposite side, relationship to known geometry and sensitivity to processing. Predictions should be written before the final classification so that one strong amplitude does not dominate contradictory evidence.
For a smooth planar reflector, expect a strong response over a limited favourable angle range and motion consistent with the plane. For a tip, expect lower amplitude distributed over a wider angular range and boundary-like movement. For geometry, expect registration with a known surface or path and repeatability in target-free locations. For material noise, expect greater spatial variability and dependence on aperture or direction.
Every observation in the ledger retains raw trace identifiers, group or view, path, coordinate transform, calibration state, processing recipe, reader and quality status. That lineage matters when the evidence is later combined. Two reconstructions from the same channel data should not silently become two independent confirmations.
The figure below shows fusion as a set of retained evidence paths rather than a blended picture.
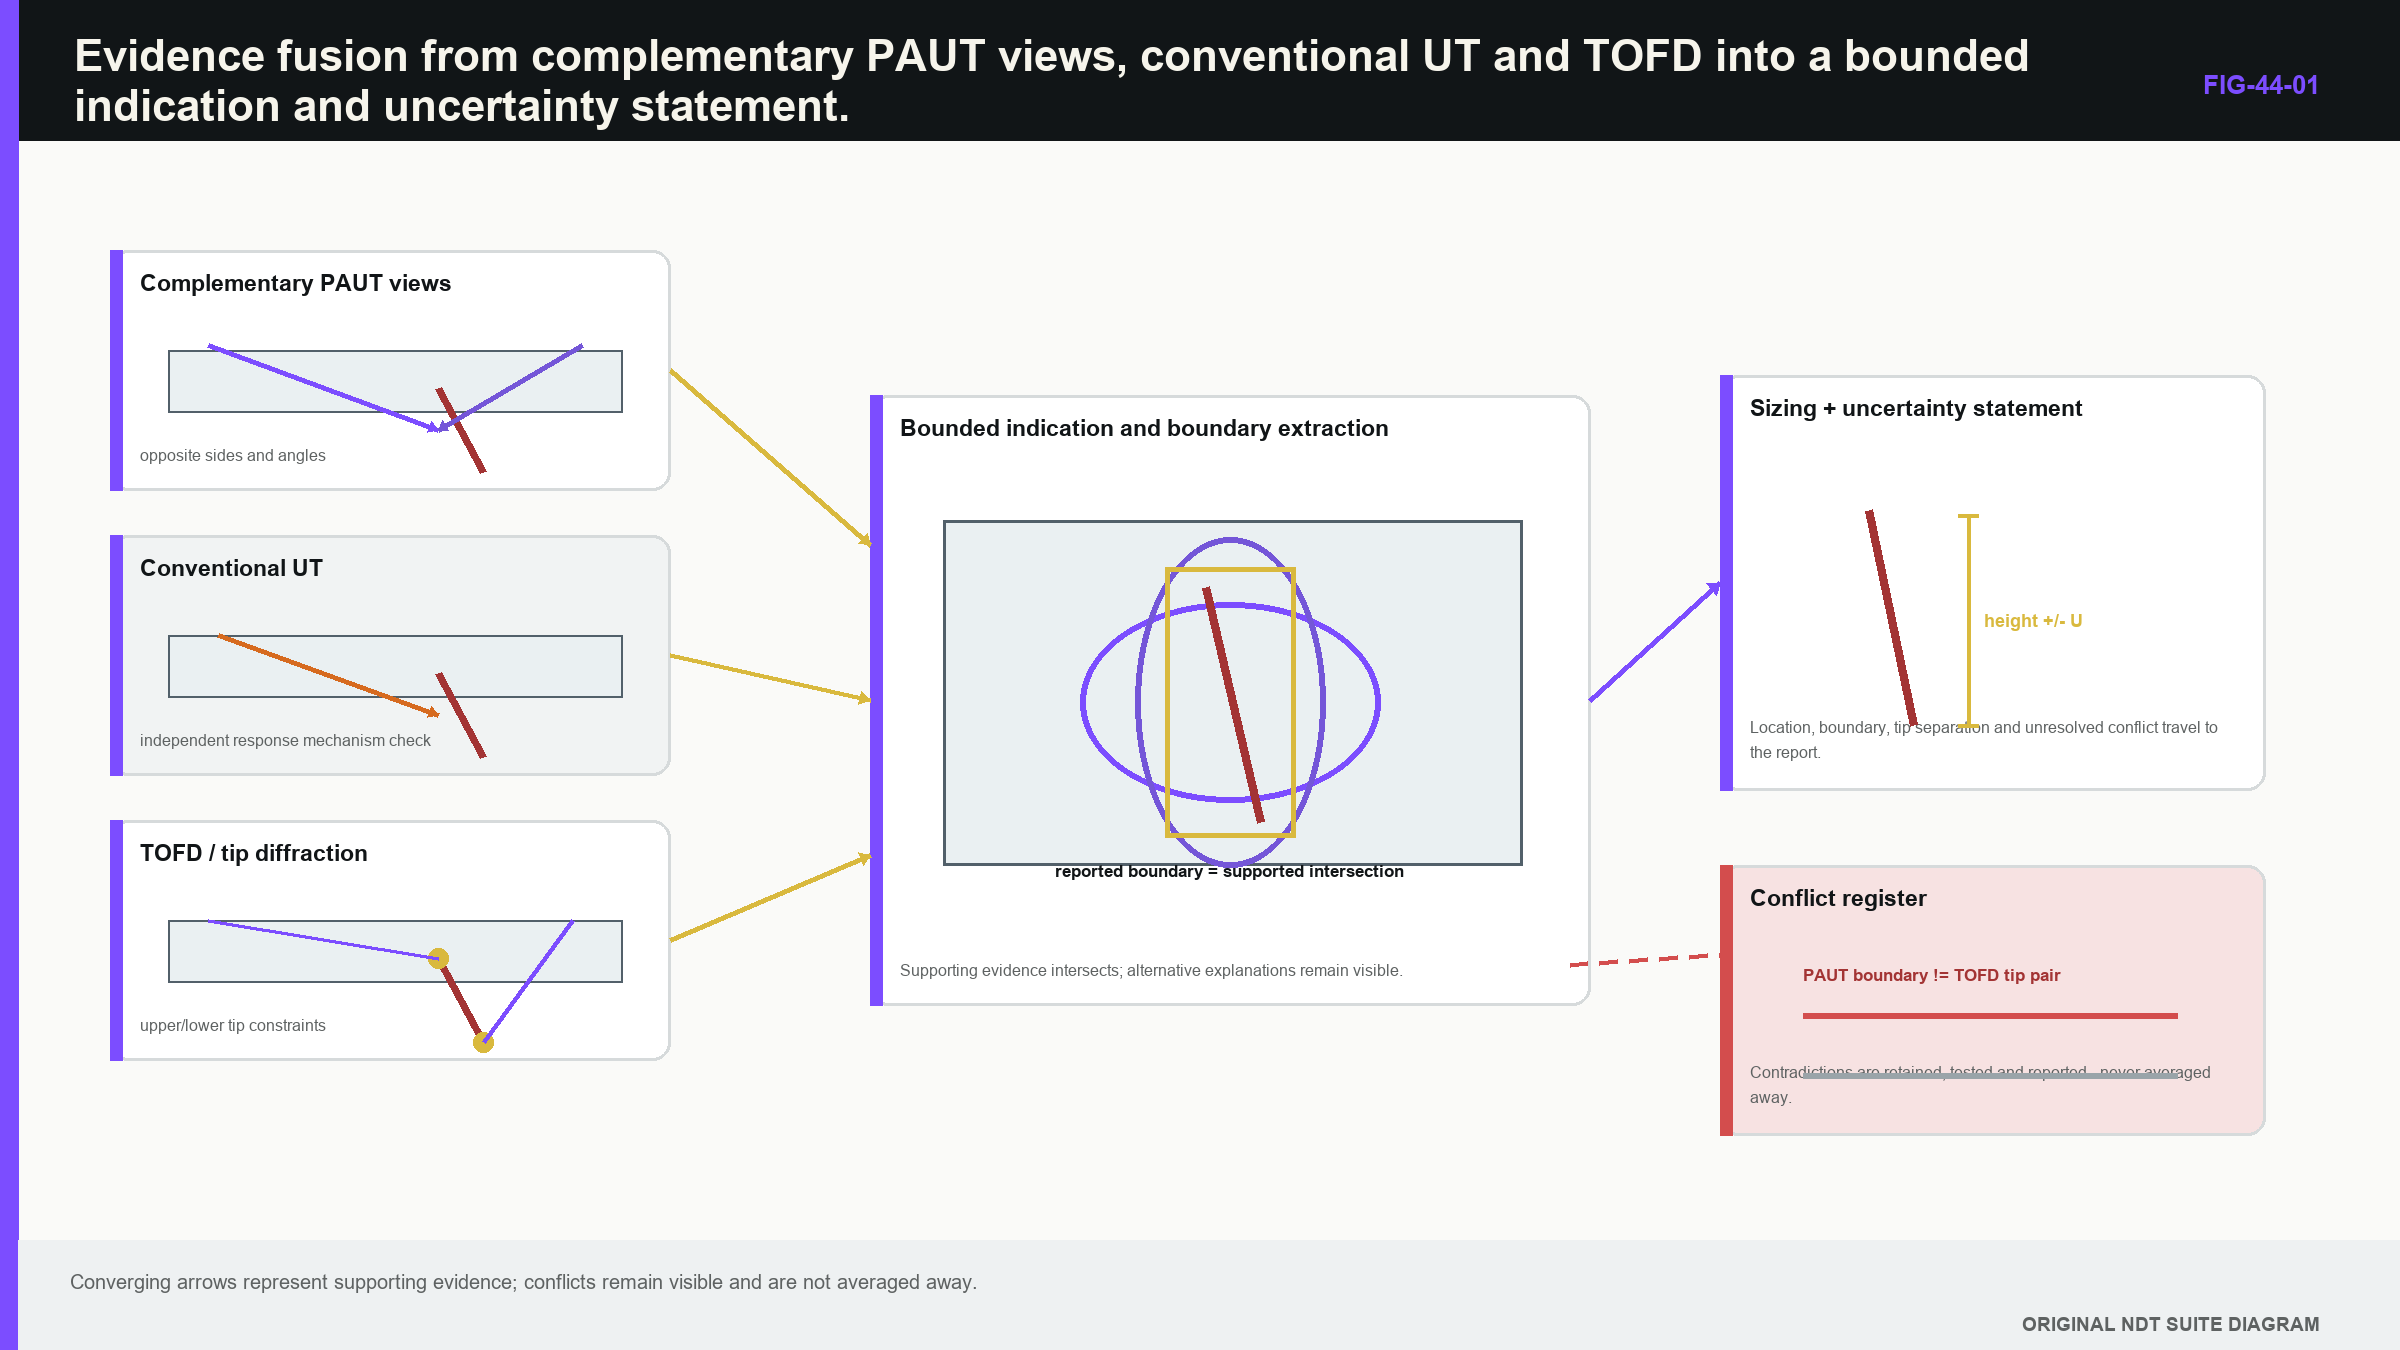
Notice that the common-coordinate and dependency checks occur before a fused conclusion is released.
44.4 Predict specular and diffracted behaviour physically
A smooth planar reflector returns strong specular energy when incident and receive geometry favour its orientation. A small angular change can produce a large amplitude change. Weak response at another angle therefore does not disprove the reflector. A strong planar response can also originate from a corner, root or component surface.
Edges and tips diffract energy over a wider angular range, usually at lower amplitude. If two tips are resolved and correctly identified, their coordinates can support height sizing. Similar point-like responses can arise from small volumetric reflectors, roughness, sidelobes or mode-converted geometry.
Probe motion and angle behaviour help. A physical boundary should move through time and component coordinates in a manner consistent with the proposed path. Waveform phase, polarity or echo dynamics may support tip identity where the qualified method uses them. No single sign is universal; it must be demonstrated for the actual system and target range.
Multi-mode and multi-view research shows that direct, reflected and mode-converted views respond differently to target orientation. [R018] It also shows that combining views can create artefacts and that structural noise changes among paths. [R019] The lesson for PAUT is to choose views by predicted sensitivity and failure mode, not by the number of colourful panels available.
In the continuing case, the side-A planar response supports a reflecting face but does not by itself locate both ends. The side-B point responses could support boundaries if their motion and path identity match. TOFD supplies different amplitude dependence, but still needs phase and coordinate checks.
44.5 Use morphology as controlled evidence
Morphology includes spatial extent, continuity, orientation, texture, angle dependence and relationship to geometry. It offers more information than maximum amplitude alone. A lack-of-fusion response may appear elongated along a fusion face and peak over a narrow angular band. Porosity may produce dispersed point responses. Geometry often tracks a predictable boundary.
Displayed morphology depends on the point-spread function and processing. Smoothing can merge separate reflectors. Thresholding can shorten or break an indication. Log compression changes apparent width. Saturation can enlarge a response. Comparisons should therefore use controlled reconstruction and display settings with raw A-scans retained.
Quantitative descriptors such as elongation, orientation or texture can improve consistency. They must be validated across expected target, SNR and artefact conditions. A segmentation algorithm can measure the wrong feature very precisely; numerical confidence does not rescue incorrect signal identity.
The failure case is a threshold chosen on bright machined notches and applied to diffuse service-like targets. The same percentage threshold can shrink one population and enlarge a saturated geometry response. Treat the threshold as a model parameter whose error is studied against target type, depth, orientation and processing.
44.6 Count complementary mechanisms, not adjacent angles
Ten neighbouring sector angles share aperture elements, material path, calibration and coordinate transform. They help show response dynamics but do not supply ten independent confirmations. One opposite-side view or a diffraction-based method may add more diagnostic information because it responds differently to orientation or geometry.
Two probes improve access and angular diversity only after their frames are registered. A systematic offset can create false disagreement or an artificially wide fused feature. Use common reference targets or established component features to test alignment across the claimed volume.
Shared dependencies should be labelled. Two PAUT groups can share the same wrong wedge geometry. PAUT and TOFD can share the same velocity or surface datum. Two software reconstructions can share the same coordinate transform. Correlated evidence can still be useful, but should not be counted as separate proof.
When views conflict, check data quality and model assumptions before ranking them. One view may be clipped, weakly coupled or outside its validated field. Another may cross anisotropic material. Unresolved conflict is diagnostic evidence that can guide a new view whose predictions differ most among hypotheses.
44.7 Register PAUT, TOFD and conventional UT before fusion
TOFD often provides diffraction-based depth information with less reliance on echo amplitude than pulse-echo PAUT. It can complement specular detection, while retaining near-surface, lateral-wave, back-wall and geometry limitations. Conventional UT can provide a movable response that challenges orientation and geometry explanations.
Fusion begins with a common component coordinate frame. Reconcile surface datum, origin, sign, units, material velocity, index offset, scan direction and curvature mapping. A PAUT depth and TOFD depth can both be internally correct yet refer to different datums.
Test registration with known features spanning the relevant region. One zero-point match does not prove scale and rotation. For a curved component, define whether surface location is arc length, chord, developed distance or projected distance. A precise C-scan ruler can measure the wrong geometric quantity.
After registration, retain separate component results. Do not average them merely because each produces millimetres. A pulse-echo threshold may estimate image extent while a diffraction method estimates physical tips. They are not the same measurand until the method establishes that relationship.
A weighted combination is defensible only when the measurands, uncertainties, correlations, bias and model validity are understood. Otherwise report separate values, explain the disagreement and apply a controlled decision rule.
44.8 Decide which physical boundaries define the size
Sizing begins by naming the dimension. Through-wall height, remaining ligament, surface length and projected length are different measurands. Then identify the physical boundaries whose separation defines that dimension.
The brightest pixel is usually not a boundary. It reflects the combined field and target scattering. Boundary methods include relative-amplitude edges, echo-dynamic ends, resolved tips, phase features or model fitting. Each selects a different observable and needs a validated relationship to truth.
Resolution creates censored results. When two tips merge, zero height is not a valid conclusion. Depending on the method, the result may be below resolution, greater than a lower bound or simply not resolved. If one boundary lies in a near-surface dead zone, report the visible boundary and a conditional or bounded result.
Grid spacing contributes quantisation but is rarely the whole location uncertainty. Velocity, delays, probe placement, registration, path, field width, target response, processing and reader selection can dominate. A fine image grid cannot create acoustic resolution or correct a wrong boundary identity.
For the continuing case, the proposed height is the difference between upper and lower physical tip locations in one registered frame. The side-A planar response supports face orientation, while side-B and TOFD features are examined as candidate tips. The ledger records which signal supports each accepted boundary.
44.9 Combine boundary uncertainty with correlation visible
Height formed from two located boundaries depends on both locations. If their errors are independent, the standard uncertainty combines by root-sum-square. If both move together because of a shared velocity or datum error, correlation changes the uncertainty of their difference.
| (44.1) Uncertainty of a difference between two boundary locations · EQ-44-01 Where: u_h = standard uncertainty of the boundary difference or height, mm; u_1 = standard uncertainty of boundary 1 location, mm; u_2 = standard uncertainty of boundary 2 location, mm; corr_12 = correlation coefficient between the two boundary estimates, dimensionless from -1 to 1 Model limits: both boundaries use a common coordinate frame; height is their signed difference; standard uncertainties and correlation describe the applicable measurement model; nonlinear and unresolved-boundary effects are treated separately |
|---|
The terms under the square root have units of square millimetres, so the result is in millimetres. When corr_12 = 0, the familiar independent root-sum-square form returns. When both boundaries share a strong positive scale or datum shift, part of that error can cancel in height while remaining in their absolute depths.
International metrology guidance supplies the general framework for standard uncertainties, covariance and reporting. [R031] [R032] It does not supply a universal ultrasonic value. The budget follows the actual boundary method, data and demonstrated range.
The failure case is important. Two readers can agree numerically because both selected the same geometry echoes. Low statistical spread does not prove correct boundaries. Signal identity and model-form uncertainty must be addressed before coordinate uncertainties are combined.
44.10 Screen a conflict without averaging it
The continuing PAUT tip method reports 6.2 mm height with 1.0 mm standard uncertainty. Registered TOFD reports 8.0 mm with 1.5 mm standard uncertainty. For the first screening comparison, assume independence and compare the difference with the combined uncertainty.
| Worked example · Testing whether two sizing results materially conflict WE-44-01 Given: A PAUT tip method reports 6.2 mm height with standard uncertainty 1.0 mm. A registered TOFD analysis reports 8.0 mm with standard uncertainty 1.5 mm. Treat the two uncertainties as independent for this screening calculation. Find: Compare the numerical difference with the combined standard uncertainty and state what the result does not establish. Steps: Calculate the size difference as 8.0 mm - 6.2 mm = 1.8 mm. With zero assumed correlation, calculate u_diff = sqrt((1.0 mm)^2 + (1.5 mm)^2) = 1.80 mm. Divide the observed difference by the combined uncertainty to obtain approximately 1. Answer: The two reported sizes differ by about one combined standard uncertainty under the stated independence assumption. Technical implication: The difference is not surprising on this screening scale, but the values should not be averaged until path, boundary identity, bias and actual correlation have been reviewed. Common mistake: Treating one combined standard uncertainty as proof that both methods measured the same boundaries, or averaging the values because the numerical difference appears statistically modest. |
|---|
The substitution case changes the conclusion. If both analyses use the same surface datum and velocity, their errors are partly correlated and the simple independent comparison is incomplete. If TOFD selected a phase feature that is not the same physical tip, the methods do not share the same measurand at all.
44.11 Establish sizing bias on the target population
Bias is the systematic difference between measured and reference dimension for a defined population. A sizing study should span relevant target heights, depths, orientations, SNR and material or geometry conditions. Plot error against these factors instead of reporting only one mean.
Patterns reveal mechanism. Constant error suggests additive bias. Error growing with height suggests proportional bias or scale. A cluster at the resolution limit suggests censoring. Depth dependence may reveal field, attenuation or coordinate effects. Method transitions can appear where two tips stop resolving.
Reference truth has uncertainty. Destructive measurement, section alignment and complementary NDT are not perfect. When truth uncertainty is comparable with apparent ultrasonic error, it must enter the analysis. A regression that treats uncertain truth as exact can overstate precision.
Separate development and validation data when a threshold or correction is tuned. Subtracting a mean error assumes a stable additive relationship. A depth-dependent correction needs a supported model. The corrected result also carries uncertainty from the bias estimate and residual variation.
Do not transfer a correction outside its validation population. A threshold tuned on smooth notches may not locate rough fatigue-crack tips. Retain original and corrected values, model version and applicable range in the analysis record. [R018] [R019] [R031] [R032] [R061] [R062]
44.12 Control reader and algorithm variation
Manual boundary selection varies among readers and across repeated sessions. A study can present blinded cases in random order while holding acquisition data fixed. This isolates interpretation variation from scanner and coupling variation.
Record boundary identity as well as final dimension. Two readers can produce the same height from different pairs of signals. Numerical agreement then hides a conceptual disagreement. Training should address why readers choose different observables rather than merely forcing consensus.
A controlled sizing method states the intended response, cursor rule, display state, allowable processing, treatment of unresolved tips and escalation path. Indeterminate outcomes are valid outputs. Requiring every reader to produce a number encourages invented precision near the method boundary.
Algorithms need the same discipline. Version, input data, segmentation, threshold and output confidence are controlled. Validation spans expected target and artefact conditions. An update that leaves image appearance similar can still move boundary coordinates and therefore needs regression testing.
Independent replay is a useful assurance control. Another competent reader or validated algorithm version sizes a sample from the same raw data without seeing the original result. Differences are examined at the signal and boundary level, not only by comparing the last number in each report.
44.13 Use predeclared conflict rules and conditional results
Conflict rules should be written before a difficult case is reviewed. Examples include using a validated diffraction size when two tips resolve, reporting a bound when one tip is hidden, or escalating when registered methods differ beyond a stated comparison criterion. These rules are application controls, not universal ultrasonic laws.
When path identity remains uncertain, report conditionally. If responses A and B are the two tips under path P, the height is h_P with stated uncertainty. Under geometry hypothesis G, no flaw height is established. This preserves useful analysis without converting an unresolved assumption into fact.
Select additional evidence because competing hypotheses predict different behaviour. If a new view repeats nearly the same path and dependencies, it adds visual volume rather than discriminatory strength. An opposite direction, a changed mode or a registered surface feature may provide the needed separation.
Composite displays remain communication layers. The released boundary measurements must be reproducible from component views and the declared fusion rule. Recolouring the same data twice does not increase evidence. Suppressing disagreement in a blended image removes the diagnostic information fusion was meant to reveal. [R023] [R024] [R044] [R047]
44.14 Hand integrity users observations, measurements and limits
Integrity assessment may require location, surface length, through-wall height, orientation and uncertainty. The NDT report supplies observations and their measurement basis without silently making fracture-mechanics decisions outside its scope.
Coordinate and geometry language must be explicit. Arc length differs from chord. Through-wall height differs from remaining ligament. Image projection differs from physical crack length. If a downstream model idealises a complex response as a planar flaw, the original NDT morphology and uncertainty should remain traceable.
Conservative reporting does not mean selecting the largest number from any view. A geometry artefact can be large. Conservatism belongs in the defined decision model with validated measurements, uncertainty and bounds.
For the continuing case, the evidence supports a planar response and two candidate boundaries, with PAUT and TOFD sizes differing by one screening combined uncertainty. If path, phase and registration checks establish common physical tips, a controlled sizing result can be released. If they do not, the report retains the planar observation, conditional sizes, unresolved boundary and additional evidence needed. [R031] [R032]
The report also preserves the evidence used to reject alternatives. A geometry hypothesis may be weakened because the response leaves the known boundary under probe motion. A volumetric hypothesis may be weakened because the feature remains continuous and narrowly angle dependent. These statements are bounded comparisons rather than claims that one sign uniquely identifies a flaw type.
Downstream users receive the accepted coordinate frame, raw-data lineage, measurement method, standard uncertainty or bound, demonstrated range and any unresolved interpretation. If later evidence changes a boundary identity, the retained ledger allows the size and integrity input to be revised without reconstructing the entire case from screenshots.
In plain words
- Interpretation compares physical explanations rather than choosing the brightest image.
- Several views are not automatically several independent confirmations.
- Specular faces and diffracted tips provide different information.
- All methods must share a tested coordinate frame before numerical comparison.
- Sizing begins by naming the physical boundaries.
- Uncertainty cannot correct wrong signal identity.
- Bias and reader studies must represent the intended target population.
- Conflict can produce a conditional result, bound or unresolved finding rather than a forced average.
Formal synthesis
Advanced PAUT interpretation is inference from traceable observations under controlled path, signal and coordinate models. Evidence fusion adds strength only when views provide complementary information and shared dependencies remain explicit. Specular, diffracted, morphological and multi-method responses are compared through predicted behaviour and an evidence ledger. Sizing identifies physical boundaries, accounts for resolution, bias, reader variation and covariance, and retains model-form uncertainty. Predeclared conflict rules and conditional reporting preserve disagreement where evidence cannot support one dimension. Integrity-facing outputs distinguish observed morphology, measured quantity, uncertainty and downstream idealisation.
Key terms
- Inference: physical conclusion drawn from observations and assumptions.
- Fusion: declared combination of evidence while retaining lineage.
- Independence: absence of important shared failure mechanisms.
- Registration: alignment of data in one coordinate frame.
- Boundary: physical feature used to define a measured dimension.
- Bias: systematic difference from reference truth.
- Conditional result: measurement valid only if a stated hypothesis holds.
Key relationships
- EQ-44-01 combines two boundary uncertainties and their correlation.
- Multiple reconstructions of shared data do not create independent evidence.
- A combined size is valid only when the methods address the same measurand.
- Shared errors can cancel in a difference while remaining in absolute position.
Common mix-ups
- More views are not necessarily more independent evidence.
- A bright image maximum is not automatically a physical boundary.
- Similar numerical results do not prove matching signal identity.
- One standard uncertainty of difference is not an averaging instruction.
- Reporting the largest artefact is not defensible conservatism.
Bridge to Chapter 45
Chapter 44 produced decisions whose validity depends on data lineage, software, coordinate models, calibration and controlled rules. Chapter 45 shows how governance follows those dependencies so that a replacement instrument, changed probe, firmware update or abnormal event repeats the right evidence rather than merely reproducing a familiar screen.
Sources and further study
- [R018]
- [R019]
- [R023]
- [R024]
- [R031]
- [R032]
- [R044]
- [R047]
- [R061]
- [R062]
Study and revision only. This is not an approved inspection procedure, acceptance criterion or qualification.