
CHAPTER 61 · FMC / TFM / PCI Level 3
Validation, Metrology, Reliability and POD
In this chapter · 30 sections
Why this matters
A software test, a calibration block and a blind trial answer different proof questions. A calculation can be correct while the physical model is wrong. A demonstration block can be detected reliably while the intended field population is not represented. Level 3 therefore needs a proof ladder that keeps verification, validation, metrology and reliability separate.
Verification checks that an implementation follows its specification. Validation checks whether the model or method is suitable for its intended physical use. Metrology controls the quantities used to support the result, such as time, position and reference dimensions. Reliability describes performance over a defined population and decision rule. Probability of detection, or POD, is one possible statistical study of that defined system; it is not a permanent property of an instrument model.
What you already need
- A reference dataset has known inputs and expected outputs.
- Timing, position and velocity uncertainty can move an image response.
- Demonstration must include relevant target and nuisance conditions.
- Detection and false calls must be evaluated together.
What you will learn
You will build an end-to-end proof ladder; distinguish numerical, model and physical evidence; select reference datasets and specimens; combine simple uncertainty components; explain the population behind a POD statement; and set release boundaries for software, technique and application changes.
Words you will meet
Verification asks whether the defined method or software was implemented correctly. Validation asks whether it is suitable for the stated physical purpose. Reliability describes repeatable decision performance for a defined system and population. POD is probability of detection under a specified study design. A covariate is a variable, such as depth or surface state, that may help explain performance variation.
The Level 3 step
At Level 2 a learner performs system checks and uses demonstration evidence. At Level 3 the learner designs the evidence chain and states what it does not cover. Statistics appear after the system, population and decision rule are defined, because an elegant curve cannot rescue a vague study question.
61.1 Separate verification, validation and reliability
Verification asks whether a system or model was implemented correctly against its specification. Validation asks whether it represents the relevant real-world behaviour for an intended use. Reliability asks how consistently the defined inspection system produces correct decisions across a population and influencing conditions. These questions overlap but cannot substitute for one another.
An algorithm can reproduce its reference image exactly while the travel-time model is wrong for the component. A field model can match one experiment while software contains an indexing defect elsewhere. A demonstration can detect every target while being too small to estimate population performance. Strong evidence uses a ladder whose rungs address distinct failure modes.
Computational V&V research separates code verification, solution verification and empirical validation. [R036] [R037] NASA computational-NDE material likewise frames modelling as support for design under controlled credibility, not proof merely because a simulation ran. [R038] The same structure applies to FMC/TFM: verify calculations, validate model observables and then assess the complete inspection decision process.
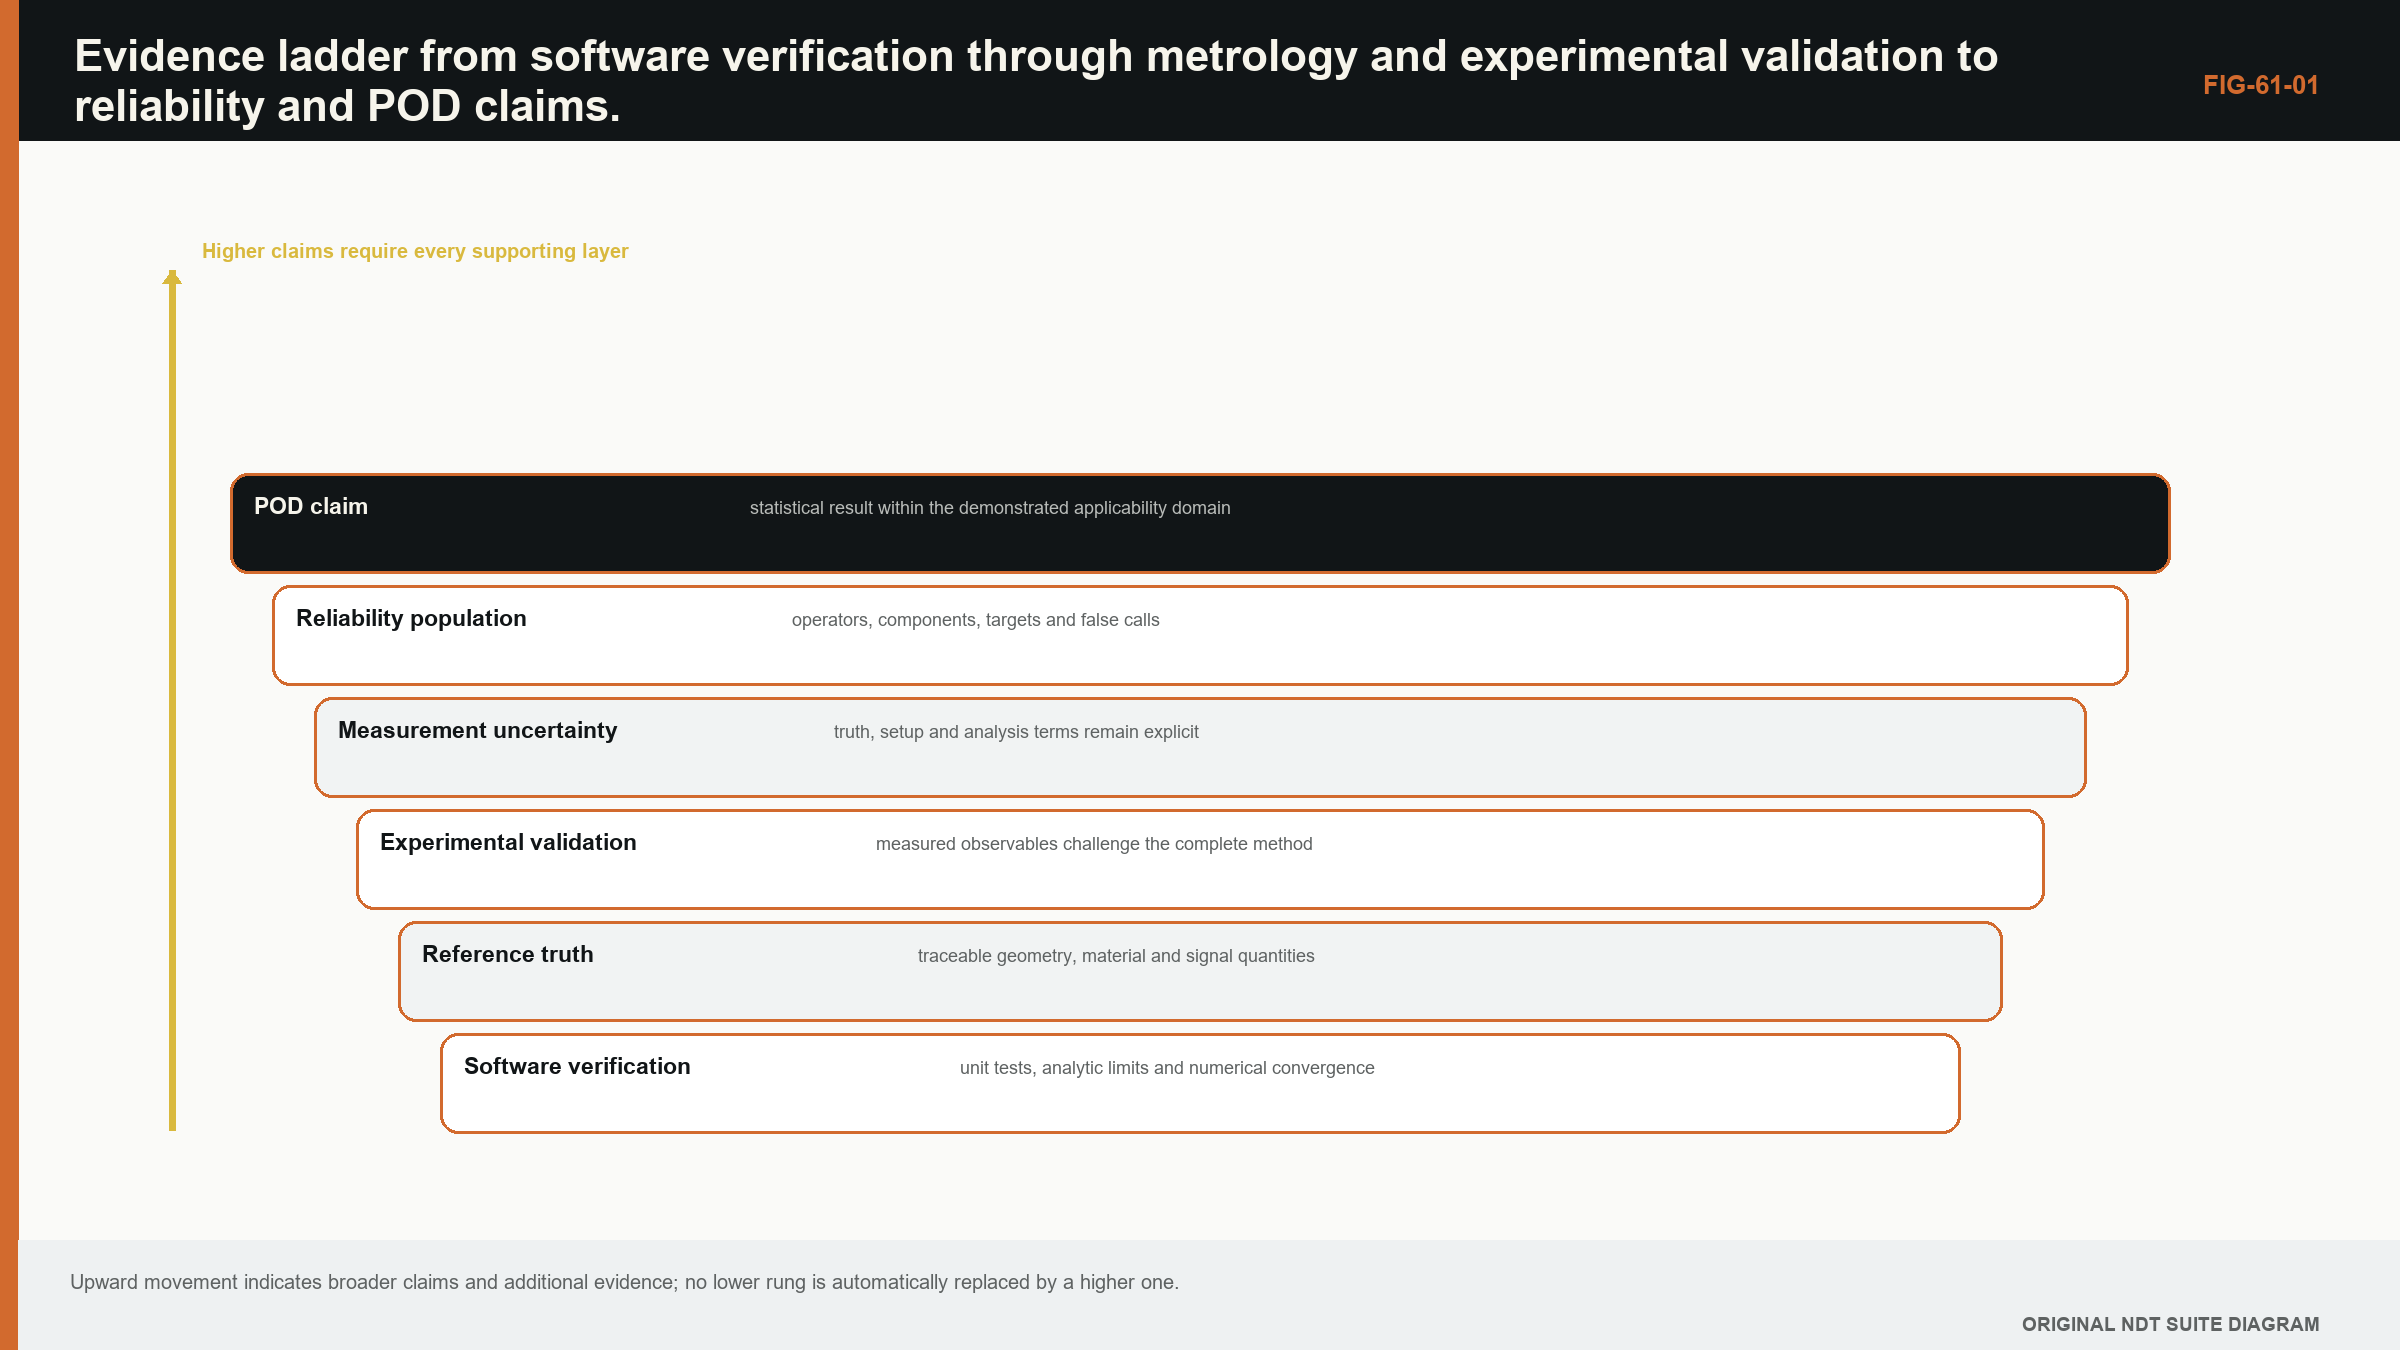
61.2 The end-to-end verification ladder
At the lowest level, unit tests address small functions: sample interpolation, delay lookup, coordinate transforms, pair indexing, normalisation and phase statistics. Analytical cases address homogeneous travel times, reciprocal symmetry and known array sums. Synthetic data address point targets, multiple paths and controlled noise. Golden datasets test the integrated pipeline.
Equipment checks address pulser, receiver, digitiser, channel timing, element activity and encoder. Reconstruction checks address known inputs and expected images. Application checks address representative material, geometry and targets. A complete-system test combines them but should not erase their identities.
Failure should stop at the correct boundary. If a unit test fails, application images are not interpretable. If application performance fails while algorithm tests pass, the problem may lie in model, acquisition or target population. The ladder helps investigation avoid random parameter adjustment.
61.3 Reference datasets
A reference dataset contains raw data, metadata, expected processing and truth information sufficient for a declared test. It should be immutable, checksum controlled and legally distributable for its intended use. A derived image alone cannot test alternative reconstruction.
Reference datasets need diversity. A noiseless symmetric point target is excellent for geometry and indexing. It is weak for clipping, grain noise, path ambiguity or reader interpretation. A suite can include analytical, synthetic, laboratory and representative component cases.
Expected output should use tolerances, not only a screenshot. Metrics can include coordinate, amplitude ratio, PSF width, residual norm and artefact location. Version changes should record which expectations change and why.
61.4 Numerical phantoms and model benchmarks
Numerical phantoms provide exact geometry and controlled scattering within the chosen model. They can sweep target position, orientation and noise far more efficiently than physical specimens. Their truth is model truth, not material truth.
Benchmarking across solvers exposes implementation and modelling differences. NASA work comparing numerical platforms with theory and experiment shows that one benchmark can reveal discrepancies without establishing general validity. [R036] Convergence, conservation and dispersion tests address numerical fidelity, while comparison with experiments addresses physical representation.
An ensemble of stochastic microstructures can explore variability, but distributions and correlation lengths need evidence. Tuning them to reproduce one scan and using the same scan for validation is circular.
61.5 Physical specimens and reference truth
Physical specimens introduce real transducers, coupling, material and noise. Their limitation is imperfect truth. Target dimensions, orientation, roughness and position have uncertainty. Destructive sectioning, machining records, CT or another method can establish truth, each with its own measurement model.
Representative specimens should span influential variables rather than merely look similar. Thickness, curvature, attenuation, weld texture, surface and target morphology can matter differently. A qualification block with known notches is one evidence type, not a miniature universe.
Blind coding and randomised target order reduce expectation bias. Repeated acquisitions should include remounting and, where relevant, different operators or systems. Repetition without changing conditions estimates only a narrow repeatability component.
61.6 Position and timing metrology
Matrix imaging relies on element coordinates, scanner position, component registration and clock timing. Position errors change path lengths and phase. Timing errors shift and defocus images. Metrology should establish scale, offset, repeatability and drift at the resolution relevant to wavelength and the reported coordinate.
An encoder's count resolution is not its accuracy. Element pitch tolerance is not the same as assembled acoustic-centre position. A CAD coordinate is not proof of component registration. Each input has a chain of evidence and uncertainty.
Cross-checks can use known reflectors at several positions and depths. A constant offset suggests origin or delay. A depth-proportional error suggests velocity. Angle-dependent residual suggests wedge or geometry. Pair-dependent residual suggests element position or timing.
61.7 Model and reconstruction uncertainty
Uncertainty sources include velocity, geometry, path branch, element position, timing, interpolation, grid, functional, noise and reader selection. Some act on coordinates, some on amplitude and some on detection probability. A single uncertainty number for the image is rarely meaningful.
Sensitivity coefficients can propagate small continuous errors. Scenario or ensemble analysis handles nonlinear path changes and categorical model choices. When two plausible path models produce different locations, model-form uncertainty should remain visible rather than averaged into a narrow Gaussian number.
Metrology guidance distinguishes component standard uncertainties, correlation, combined uncertainty and expanded uncertainty. [R031] [R032] The framework supports transparent reporting, but the actual components come from the matrix-imaging measurement model.
| (61.1) Monte Carlo estimate of output uncertainty · EQ-61-01 Where: u_y = sampled standard uncertainty of output; y_m = output from uncertain-input sample m; y_bar = sample mean; M = number of valid samples Model limits: sampled input model and reconstruction represent relevant uncertainty sources and M is sufficient for the required estimate |
|---|
61.8 Blind trials and decision rules
Reliability trials must include the decision process. If production uses a human reader with multiple views, the trial should include that reader process. If production uses an automatic threshold, the threshold and version should be locked before confirmation data are analysed.
Training cases and qualification cases should be separated. Readers should not know target truth. Rules for rescanning, indeterminate calls and technical assistance should be declared. Otherwise trial conduct becomes an uncontrolled variable.
False calls matter. A method can detect every target by declaring every feature relevant. Record non-target indications, investigation burden and any geometry falsely classified. The balance depends on application consequence, but both sides belong in evidence.
61.9 POD and response analysis
POD is a relationship between target parameter and probability that the defined inspection system produces a defined detection. It belongs to a specified population and decision rule. Hit-miss methods model binary outcomes. Signal-response methods model a continuous response and threshold when their assumptions are met.
MIL-HDBK-1823A provides a recognised reliability framework but is guidance rather than a universal contractual requirement. [R033] NASA's POD guidebook emphasises specimens, operators, flaw distributions, thresholds and analysis design. [R034] ASTM's public hit-miss POD scope likewise identifies a defined inspection and known flaw sizes, with convergence and model fit required. [R052]
Confidence bounds are essential. The a90/95 concept, where applicable, expresses a target size associated with 90% POD at 95% confidence under the fitted model. It is not the smallest flaw found in a demonstration. Extrapolation beyond observed sizes is hazardous.
61.10 False-call and reliability measures
False-call probability or rate needs a denominator: per scan length, component, region or non-target opportunity. Different definitions are not directly comparable. The population of geometry and benign conditions should be representative.
Receiver-operating-characteristic analysis explores threshold trade-offs when a continuous score exists. Selecting a threshold on the same data used to report performance biases results. Separate validation data or nested study design is needed.
Inter-reader and intra-reader variation can be modelled when people interpret data. Reader learning, fatigue and case order can influence outcomes. Randomisation and repeated cases help estimate these effects.
61.11 Software verification and change impact
Software verification includes requirements, code review, unit tests, integration tests, static analysis where appropriate, regression datasets and release identity. A result should retain algorithm and configuration versions. Complete-system standards scopes can include TFM image tests while explicitly not proving application suitability. [R045]
A change impact assessment maps modified code or parameter to technical functions and claims. An optimisation that changes only runtime still needs output comparison. A change in interpolation or travel-time solver directly affects phase and coordinates. A display-only change can affect human interpretation even if raw arrays are unchanged.
Comparability testing should include sensitive cases, not only typical images. Pair-count boundaries, low SNR, high steering and path transitions often reveal changes first.
61.12 Reliability evidence and release boundaries
Evidence should end in a claim matrix: output, range, target population, conditions, evidence and limitation. It should distinguish verified software functions, validated model observables, demonstrated targets and statistically supported reliability.
ASTM's public FMC/TFM sizing practice confirms a current domain-specific standard exists, but protected details and universal performance are not inferred. [R050] Standards orient governance; the inspection system's own evidence establishes capability.
Commercial evaluations can provide useful external cases while remaining bounded by equipment, specimens and metrics. [R061] A release decision should be based on the evidence chain for the intended system.
| Worked example · Combining timing and registration uncertainty WE-61-01 Known: For a direct longitudinal pulse-echo coordinate, timing standard uncertainty is 30 ns at 5,900 m/s, encoder standard uncertainty is 0.20 mm and component-registration standard uncertainty is 0.35 mm. Treat them as independent. Find: Estimate combined standard coordinate uncertainty for these terms. Method: Timing contribution is 5,900(30e-9)/2 = 0.0885 mm. Combine: sqrt(0.0885^2 + 0.20^2 + 0.35^2) = 0.413 mm. Result: Combined standard uncertainty is about 0.41 mm for the included terms. Engineering meaning: Grid spacing and display precision do not reduce this value. Velocity, path, element coordinates, model form and reader localisation must be added if material. |
|---|
61.90 Technical extension: designing credible reliability studies
61.90.1 Claim-to-test mapping
Each performance claim should map to a test statistic and data source. Coordinate accuracy maps to differences from reference truth. Sizing maps to bias and spread over a dimension range. Detection maps to binary or response data. False calls map to defined non-target opportunities.
The mapping identifies when one trial cannot answer another claim. A hit-miss study with coarse truth may support detection while providing weak sizing evidence. A high-resolution sizing block may contain too few non-target conditions for false-call inference.
61.90.2 Study populations
Define component, material, target, operator, equipment and environment populations. Sampling only convenient specimens narrows inference. Stratification can ensure difficult thicknesses or orientations are represented; weights may be needed if sample proportions differ from use.
Clustered targets in one specimen are not fully independent because they share material, acquisition and operator conditions. Statistical analysis should consider specimen and reader effects rather than treating every target as independent.
61.90.3 Sample-size reasoning
Sample size depends on desired precision, target distribution, model and confidence. A fixed number copied from another study is not sufficient. Simulate candidate study designs using plausible coefficients and variance to estimate whether they can resolve the required reliability range.
All-hit results still have uncertainty. For zero failures in n independent trials, a simple one-sided 95% rule-of-three scale leaves failure probability around 3/n; this approximation is not a substitute for the planned POD model but shows why ten successes are weak evidence of near-perfect reliability.
61.90.4 Response-model diagnostics
Signal-response POD models require a monotonic relationship, suitable residuals and stable variance or an appropriate alternative. Plot response versus size, inspect censoring and saturation, and test whether transformations improve assumptions.
Hit-miss logistic or probit models need enough transitions between misses and hits. Complete separation, where all small targets miss and all large targets hit with no overlap, can make coefficient estimates unstable despite a visually perfect boundary.
61.90.5 Confidence and coverage
Confidence bounds reflect sampling uncertainty in the fitted relationship. They do not include every model-form or population uncertainty automatically. Sensitivity to link function, influential cases and target measurement uncertainty should be examined.
Report the data range. A fitted curve outside observed flaw sizes is extrapolation. If the desired a90/95 lies beyond the data, the study has not demonstrated it.
61.90.6 Reader studies
Multi-reader multi-case designs can estimate reader and case variation. Readers should follow the intended analysis procedure, with training separated from test cases. Case order and fatigue can be randomised or balanced.
Consensus reads answer a different question from individual production reads. If production requires independent review, the study should represent that decision process rather than averaging readers after the fact.
61.90.7 Model-assisted evidence
MAPOD combines simulation and physical evidence to expand conditions when the model is validated for the intended influencing variables. It does not multiply specimen counts by simulation runs. Model discrepancy and uncertainty enter the reliability inference. [R035]
Physical tests should challenge model assumptions and anchor response distributions. Simulation can explore rare combinations, but input distributions and flaw scattering need evidence.
61.90.8 Reproducible statistical analysis
Retain de-identified trial data, analysis code, software environment, model choices and diagnostic plots. Predefine exclusions and handling of indeterminate results. Changes after seeing outcomes should be recorded with sensitivity analysis.
An independent statistical review can challenge both fit and study design. A smooth POD curve is not evidence that the data or population support it.
61.90.9 Linking reliability to change control
When equipment, algorithm or population changes, assess which reliability factors shift. A display palette may affect reader response; a path solver changes localisation; a probe changes field and SNR. Bridge data can support comparability, but a material mechanism change may require new reliability evidence.
Control charts and field feedback can detect drift after release. They do not replace the original qualification and must handle uncertain ground truth.
61.90.10 Evidence boundaries
The final reliability statement names inspection system, target parameter, population, decision rule, confidence method and range. It also reports false-call behaviour and material limitations. That precision prevents a study result from becoming a slogan detached from its evidence. [R031] [R032] [R033] [R034] [R035] [R045] [R050] [R052]
61.91 Linking metrology to POD covariates
Reliability analysis can include covariates such as depth, orientation, material noise, reader or system when study size supports them. Covariates should be chosen from physics and technique sensitivity, not data-mined until significance appears. Interactions can reveal that a nominal overall POD hides a weak subgroup.
Flaw-size truth has uncertainty. Treating measured size as exact can bias the fitted relationship, especially when uncertainty is comparable with the transition range. Errors-in-variables or sensitivity analysis can show impact. The truth method and coordinate registration belong in the study record.
Detection thresholds can drift with calibration or software. A study threshold must map to the controlled production rule. If readers adjust display or use judgement, the trial must represent and document that process.
POD results should be accompanied by study diagnostics: target distribution, misses and false calls, fit, confidence bounds, influential cases and applicability. A single a90/95 value without those conditions is easy to misapply.
When MAPOD is used, validation covers both forward response and the distribution of influencing variables. Model discrepancy is propagated rather than assumed zero. Physical tests anchor the region where simulation informs reliability. [R033] [R034] [R035] [R052]
61.92 Validation of human-algorithm interaction
Advanced systems present processed views that guide reader attention. Reliability therefore depends on interface, default scale, linked cursors, alarms and access to raw evidence. A study using expert researchers with unlimited processing does not represent a production reader using a locked workflow.
Measure how readers respond to algorithm confidence, coherence and false-colour emphasis. Automation bias can cause acceptance of a confident wrong overlay; distrust can cause useful prompts to be ignored. Blind cases with known algorithm successes and failures reveal calibration of reliance.
If an algorithm preselects indications, missed preselection cases may never reach the reader. POD then belongs to the serial combination of algorithm and human. Study design and reporting should reflect the combined decision path.
Interface or workflow changes can therefore require bridge reliability evidence even when reconstruction arrays are numerically unchanged. [R033] [R034] [R045] [R052]
61.93 Reliability release question
The release reviewer should be able to state the defined inspection system, target population, decision rule, false-call basis, confidence method and range supported by data. Any missing element narrows the POD statement, regardless of how smooth the fitted curve appears. [R033] [R034] [R052]
61.94 Population drift
If material, target morphology, operators or software change after the study, monitor whether the reliability population has drifted. A statistically strong historical POD result does not automatically describe a new population. [R034] [R052]
Chapter synthesis
Verification establishes correct implementation; validation establishes adequacy for intended physical use; reliability measures the complete decision process over a population. Evidence progresses from unit and analytical tests through reference datasets, numerical phantoms, physical specimens, metrology and blind trials. Reference truth and uncertainty must be explicit. POD requires a defined target variable, decision rule, population, statistical model and confidence bounds, with false calls considered. Software changes need technical impact and comparability evidence. Release claims should show which rung supports each output and where the evidence ends.
Key equations and relationships
| (61.2) Logistic hit-miss POD model · EQ-61-02 Where: POD(a) = fitted detection probability at flaw parameter a; beta_0 and beta_1 = fitted coefficients Model limits: independent binary outcomes conditional on a, suitable link and flaw parameter, adequate model fit and a study design supporting the intended inference |
|---|
In plain words
- The chapter's central control is validation, and its meaning must be stated before its mathematics or software implementation.
- A faster, sharper or cleaner result is not automatically a more reliable result.
- Every claimed improvement depends on a declared dataset, model, configuration and target population.
- Known reference cases and deliberately difficult cases reveal different weaknesses.
- Stored raw evidence, metadata and software identity make later review possible.
- The technical conclusion must remain inside the boundary demonstrated by the evidence.
Key terms in this chapter
The words introduced at the chapter opening are the minimum vocabulary for its Level 3 work. Use them consistently in the technique, validation record and report. Where a supplier uses a different label, record the supplier term without allowing it to replace the physical definition.
Common mix-ups
- Do not confuse a similar displayed image with equivalent retained information.
- Do not confuse software verification with physical validation of an inspection technique.
- Do not confuse an assumed model output with a directly observed quantity.
- Do not confuse a demonstrated result for one target population with universal capability.
Independent review checkpoint
Give a second competent reviewer the raw or reference data, the declared validation method, the controlled configuration and the expected comparison outputs. The reviewer should be able to reproduce the important result without using an undocumented display adjustment or private software setting. Record the version, input identity, contributor or channel mask, model inputs, numerical tolerances and any excluded cases. Also record one observation that would contradict the preferred explanation. Where the result supports a decision, the reviewer records the nearest failure boundary and one realistic change that would trigger revalidation. This checkpoint does not turn independent review into a ceremonial signature. It tests whether the evidence chain is understandable, repeatable and honest about its limits.
Bridge forward
Chapter 62 applies the proof mindset to unexpected data and builds a repeatable forensic diagnostic process.
Sources and further study
- [R031]
- [R032]
- [R033]
- [R034]
- [R035]
- [R036]
- [R037]
- [R038]
- [R045]
- [R050]
- [R052]
- [R061]
Study and revision only. This is not an approved inspection procedure, acceptance criterion or qualification.